Geomagnetic Storm Visualization
Concept: As an artist in resident at the Space Research Center, University of Michigan—Ann Arbor, I’m specifically working within the NASA funded Magnetometer Lab. I’m collaborating with my fellow resident artist—a percussionist—to develop an immersive environment within a CAVE (Cave Automatic Virtual Environment). We want to introduce an experiential narrative of a geomagnetic storm so that it can be understood beyond a purely scientific perspective.
My Role: Artist in Residence
Deliverables: Virtual Reality (VR) Experience in a CAVE (Cave Automatic Virtual Environment)
Timeline: 1/2019 - 4/2019
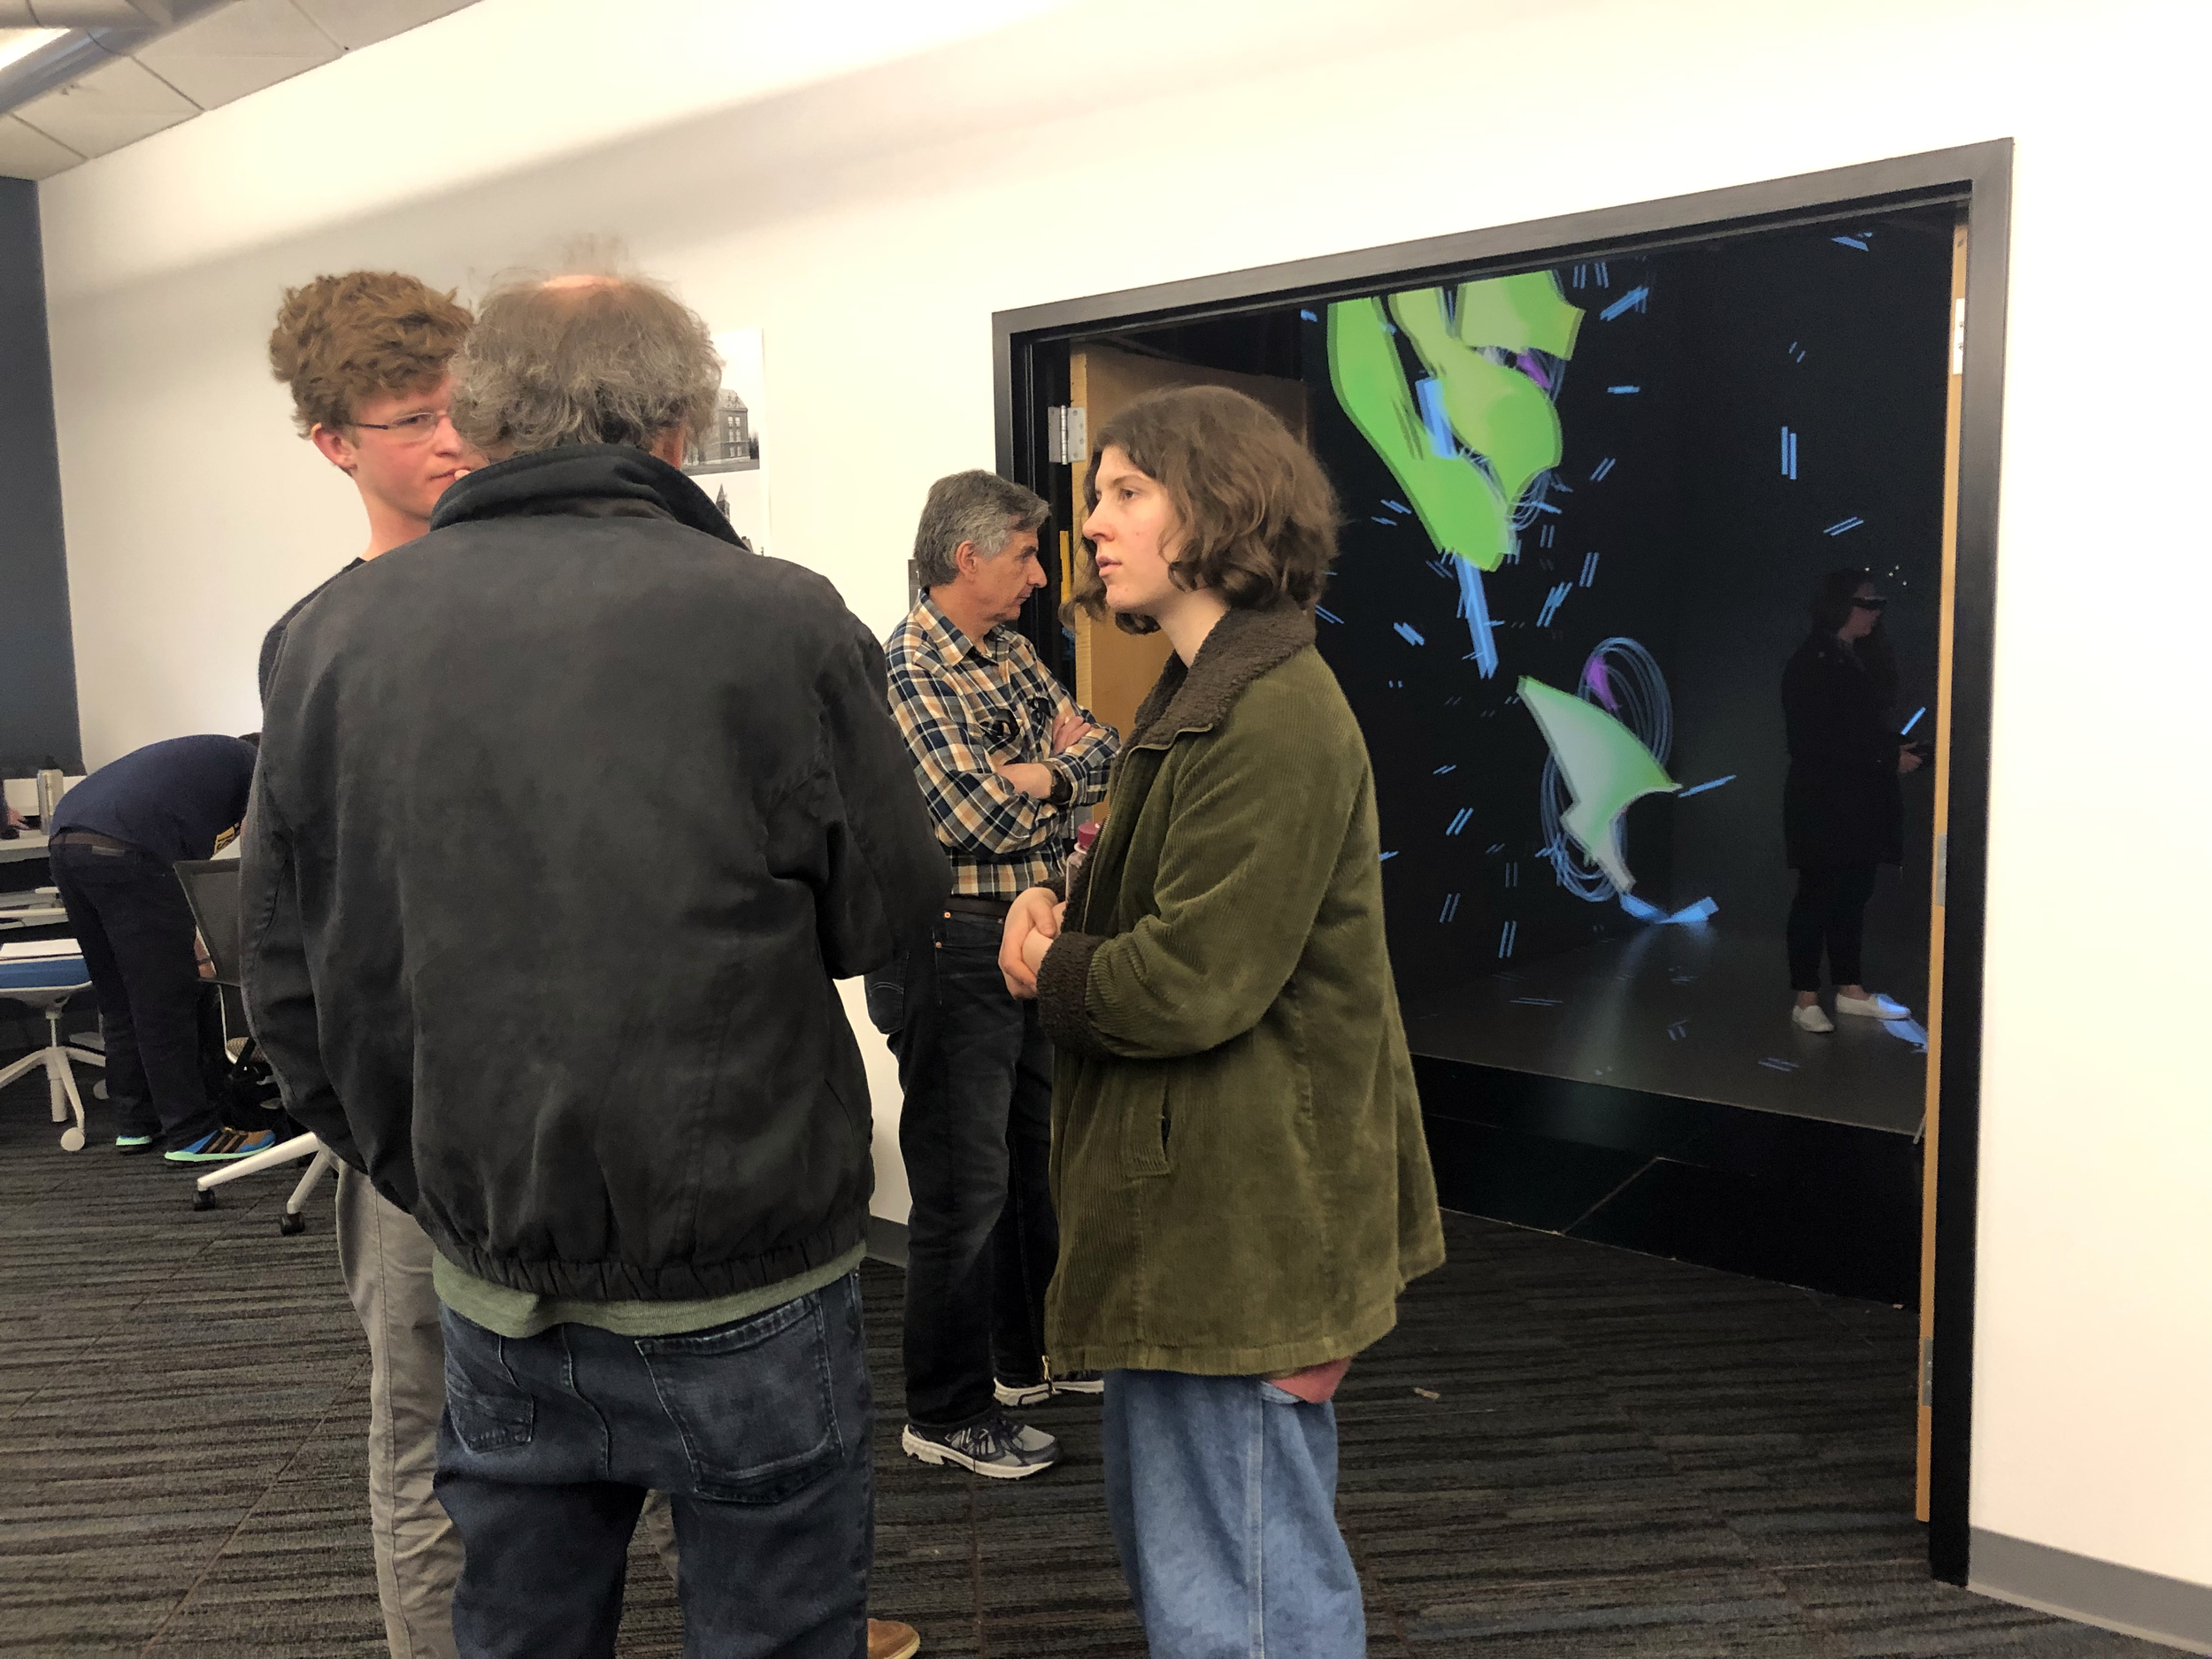
Recognition: The residency project was featured as an interdisciplinary student application in the Augmented Reality, Virtual Reality, and Mixed Reality: Opportunities and Issues Teach-Out on Coursera. The project was shortlisted for the Lumen Photomonitor Student Award Shortlist and presented at the Lumen Awards Ceremony at the Barbican Centre in London.
The artists presented the residency project at the 2020 Media & Studio Arts Symposium located at the Duderstadt Center, University of Michigan.
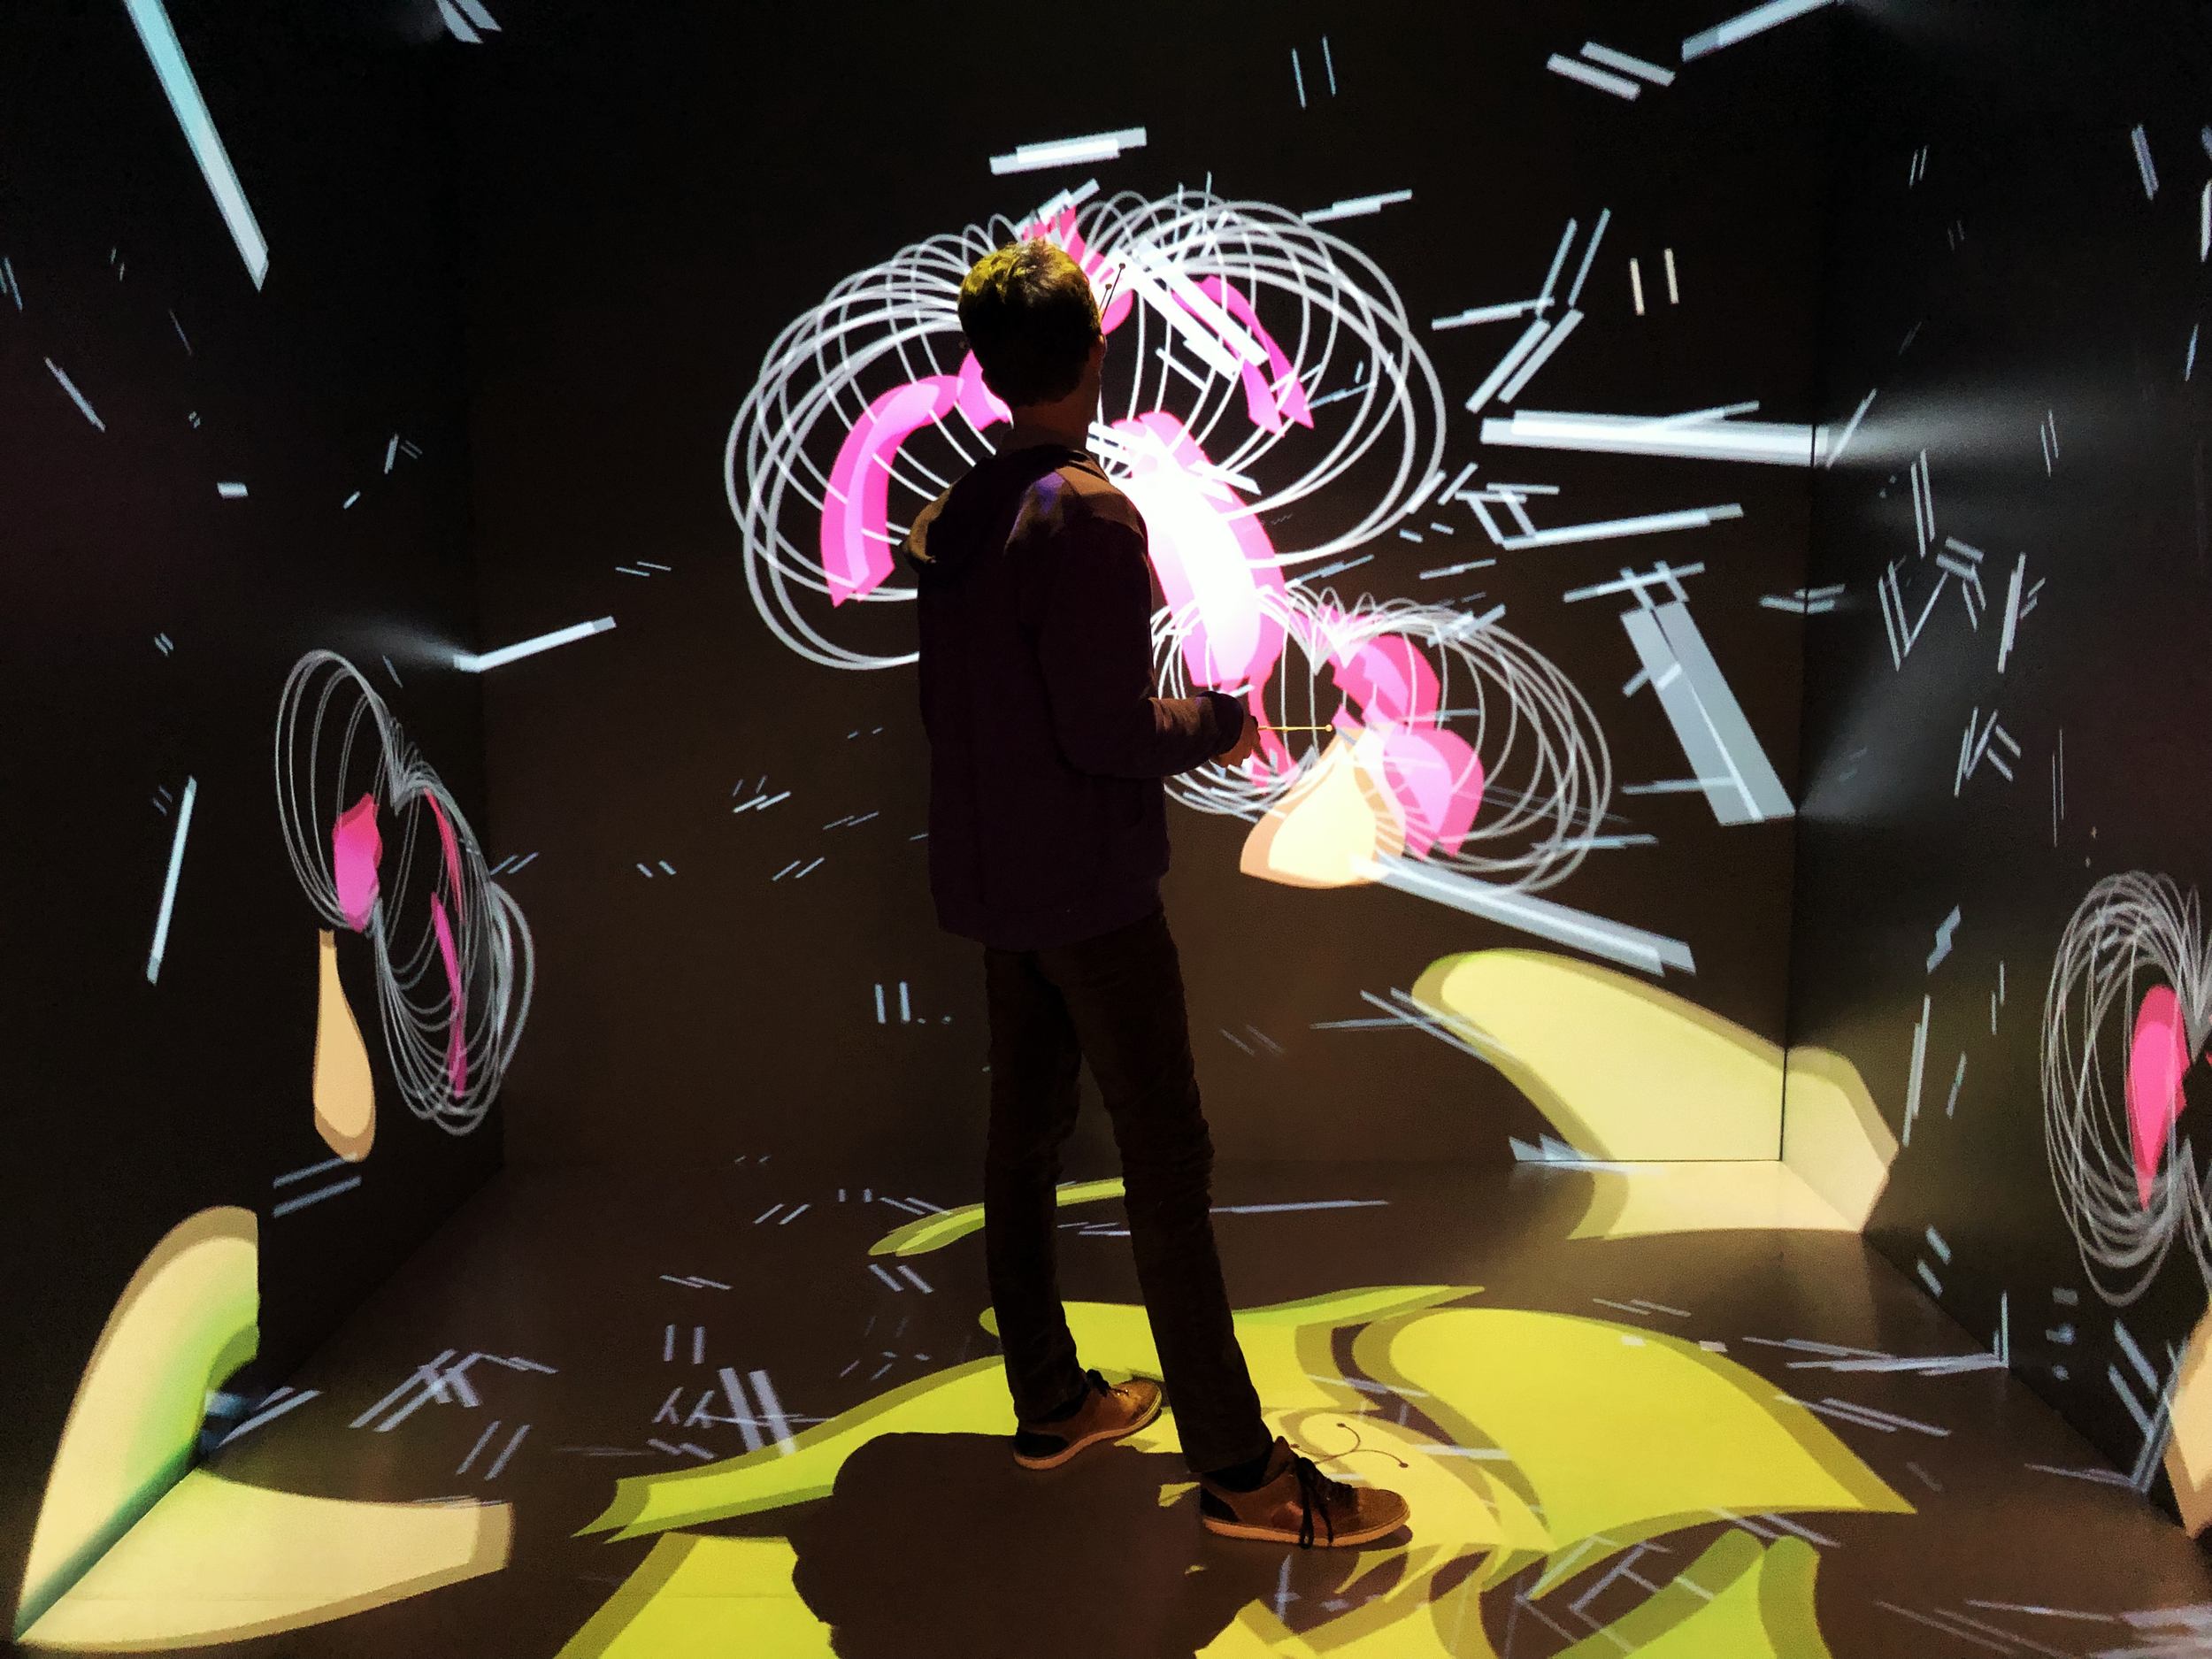
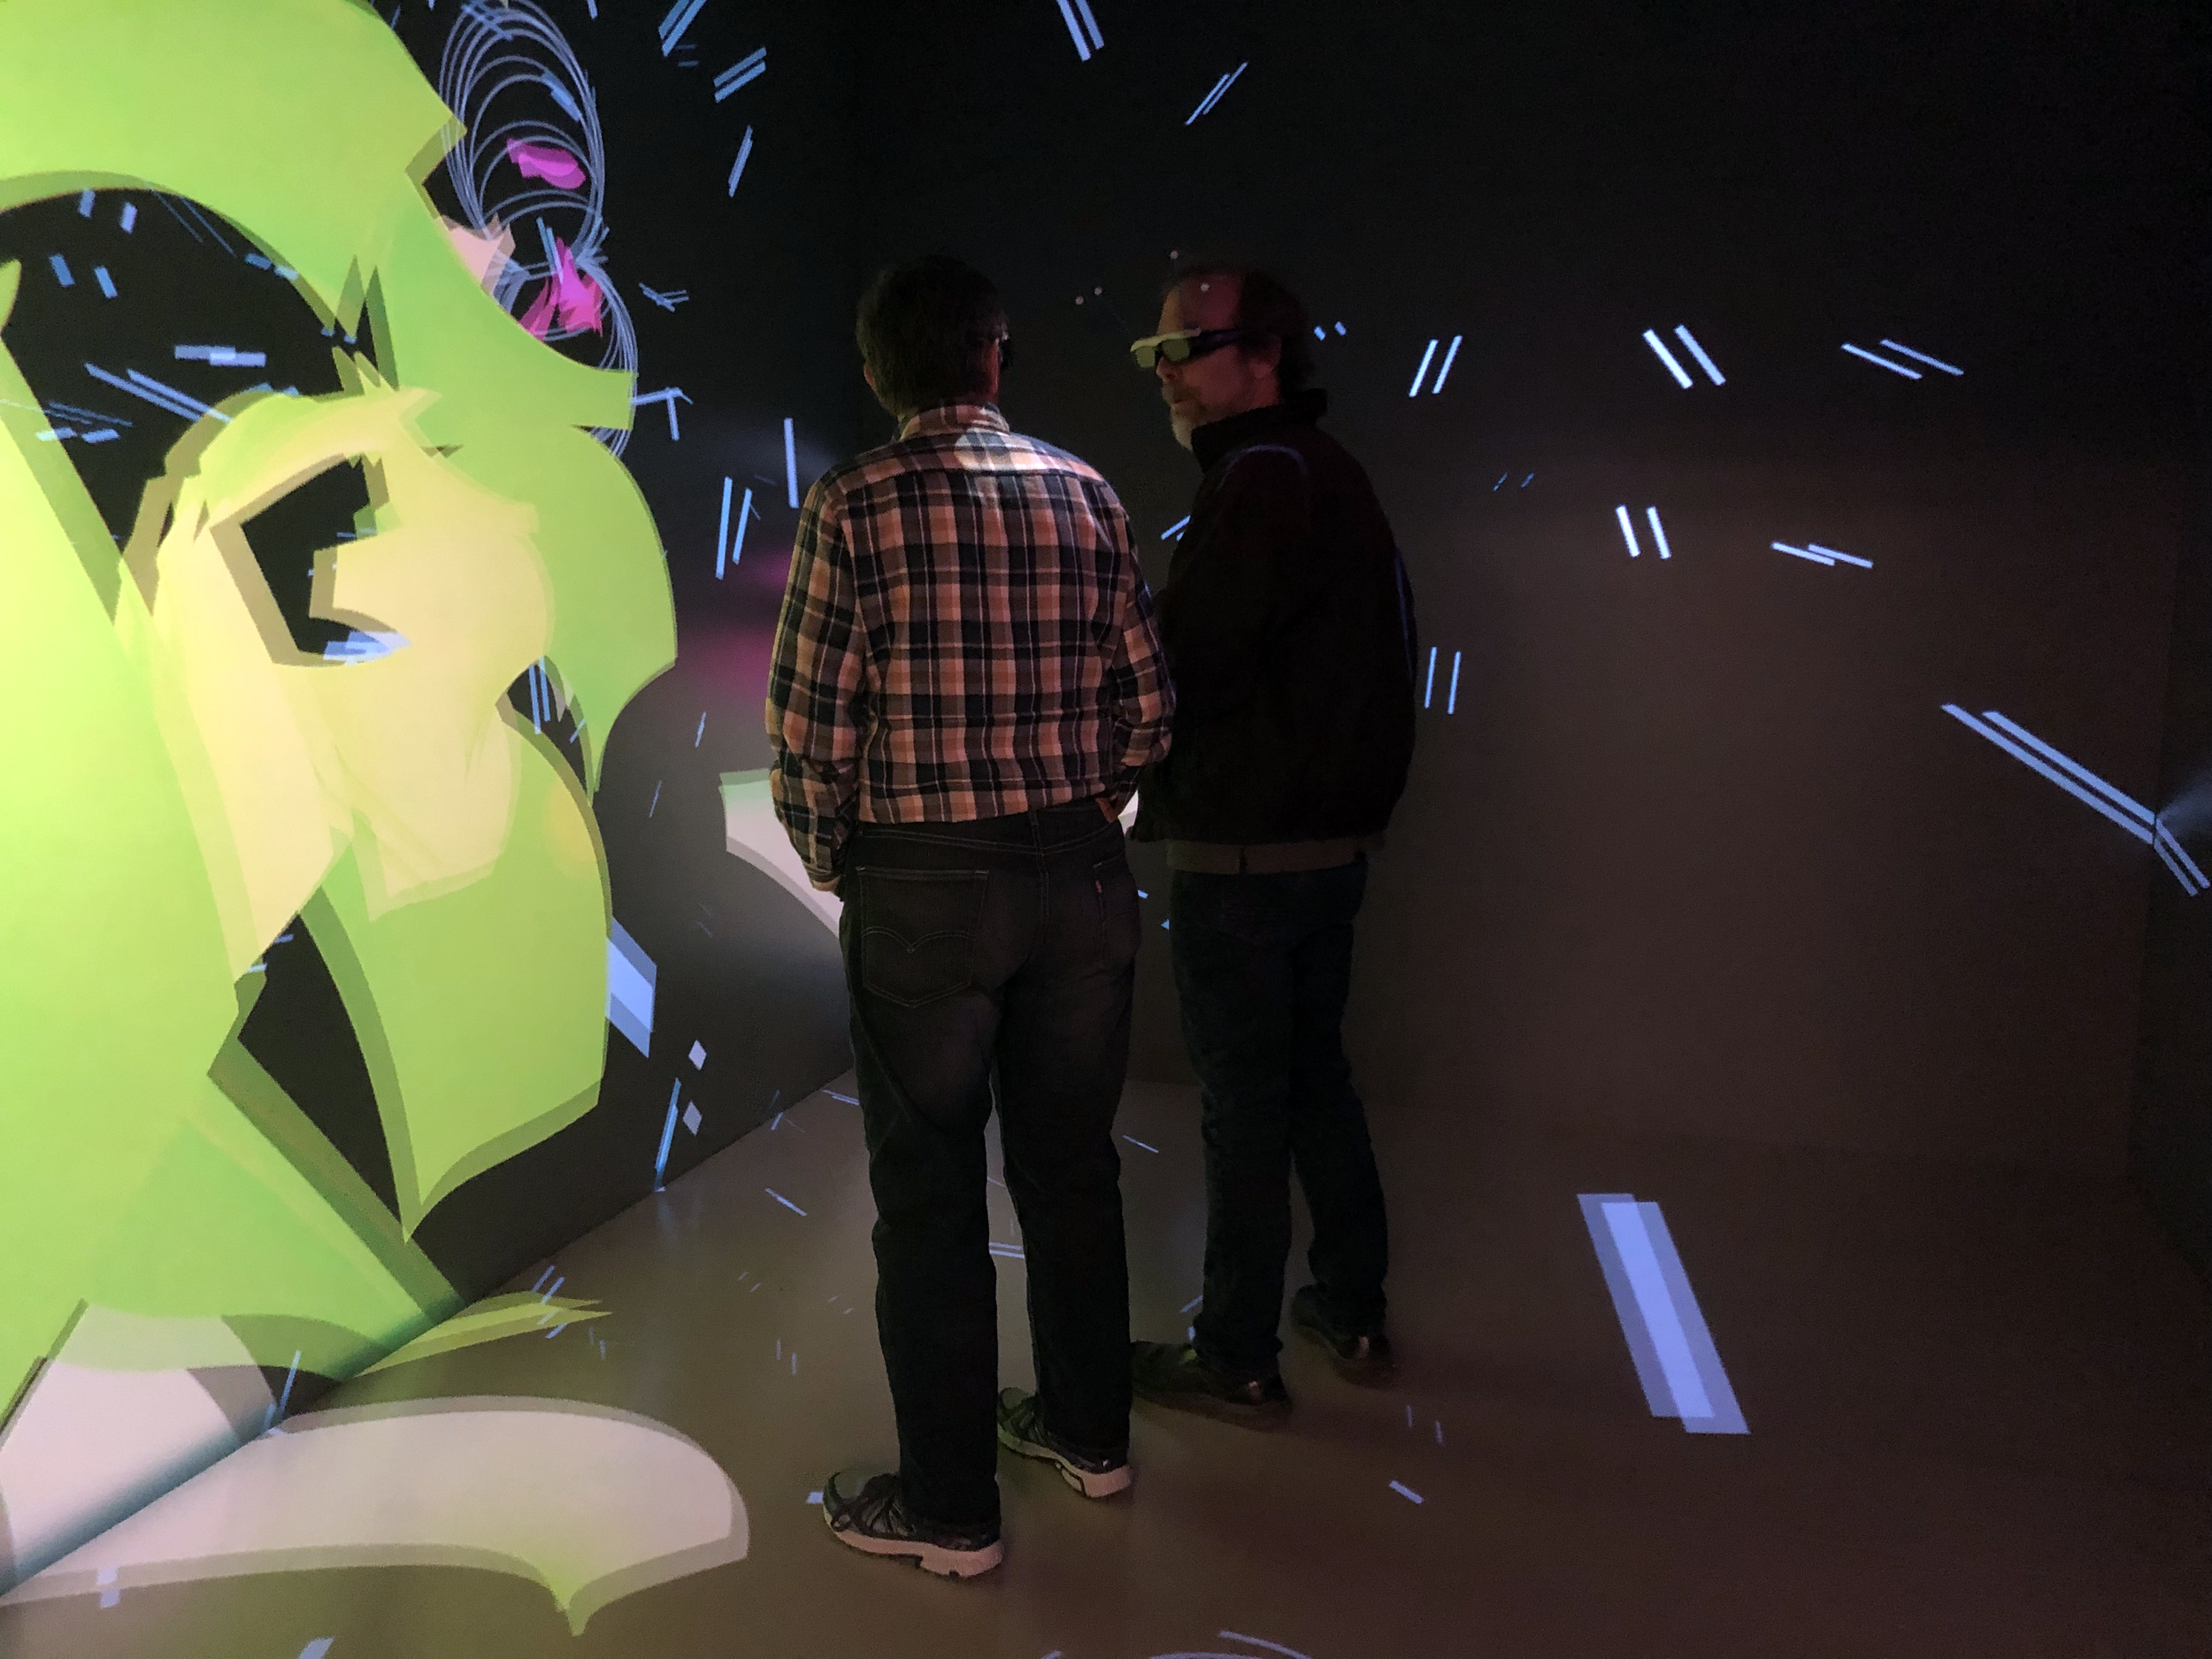
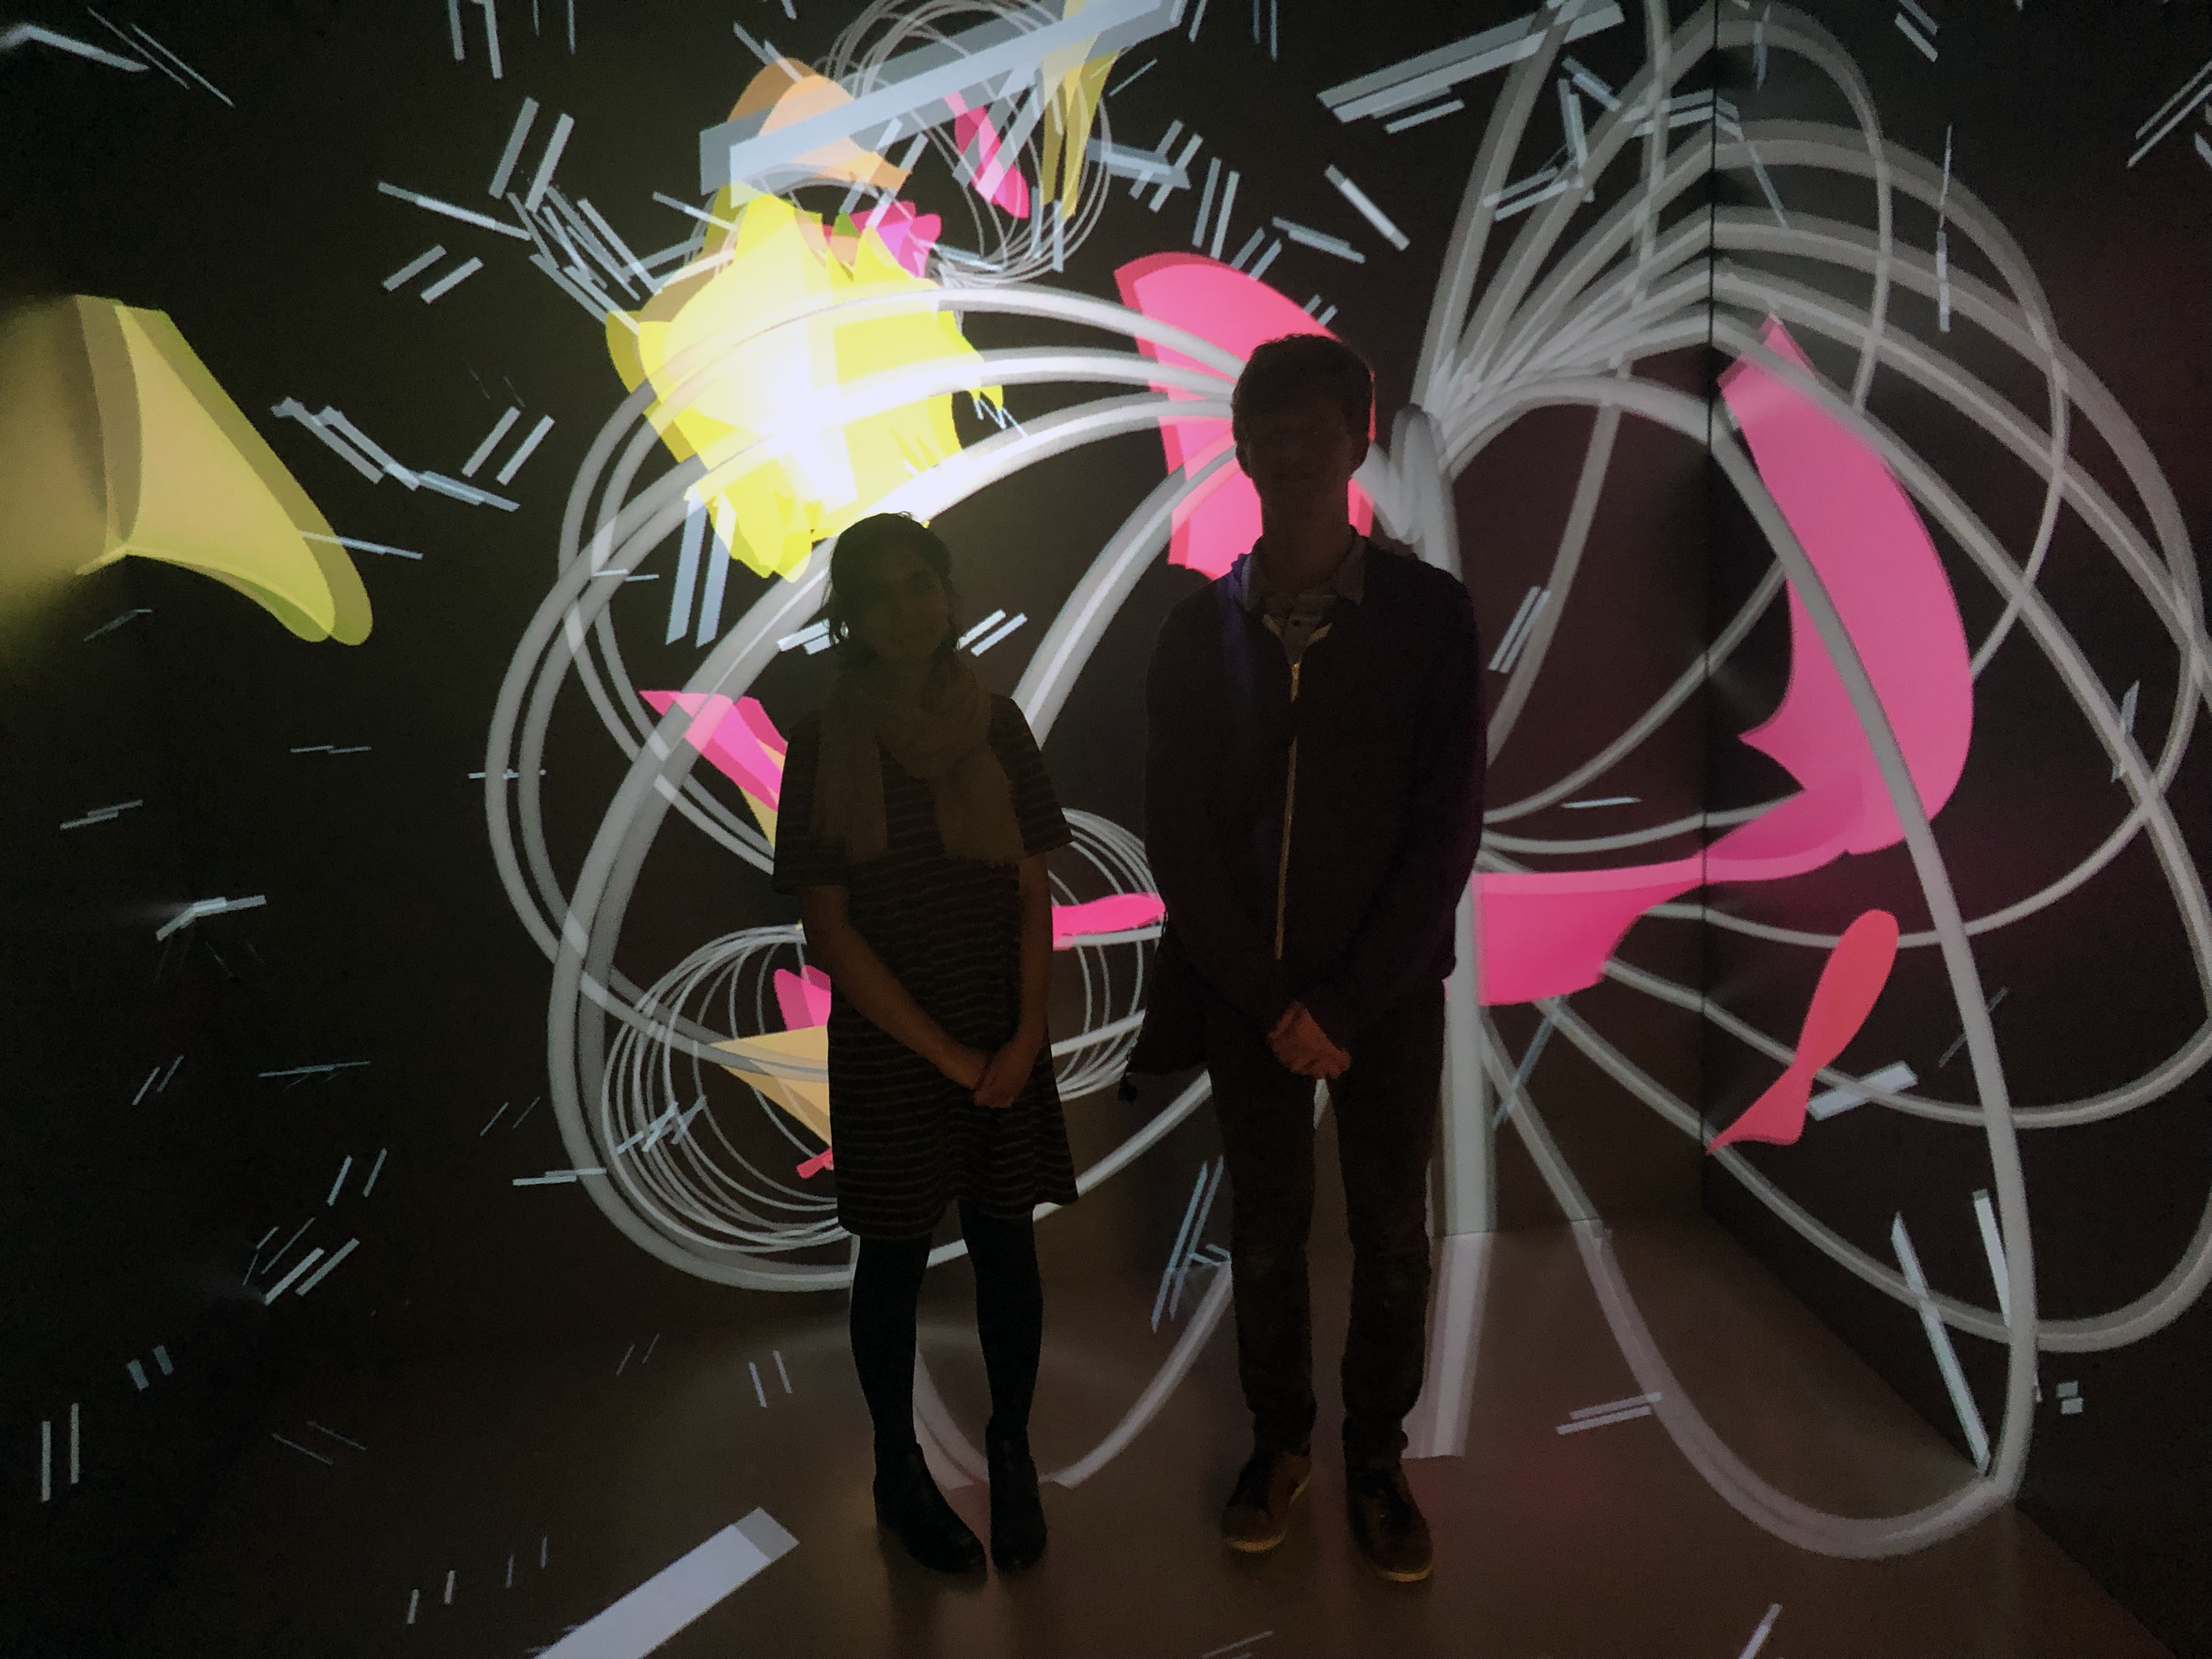
CAVE Installation
Research and Scoping
St. Patrick’s Day (2015) Geomagnetic Storm: To develop an initial understanding of climate and space research, I attended weekly meetings at the Magnetometer Lab and personally met with researchers. At meetings, researchers repeatedly mentioned the geomagnetic storm that occurred on March 17th, 2015 (St. Patrick’s Day). This specific geomagnetic storm was the strongest geomagnetic in the last decade (Solar Cycle 24) and thus heavily studied within the field.

Geomagnetic Storm Process: Identifying key steps within the geomagnetic storm formation allowed me to narrow down my project scope. I was more interested in the near Earth processes—such as the solar wind and the geomagnetic field interaction or the Aurora Borealis sightings—since people had a more direct perception and identification of such phenomenon.
For a brief summary of the geomagnetic storm progression, it starts when coronal mass ejections (CMEs) from the sun are flung into space and energize the proton levels near Earth. As a result, the solar winds in Earth’s magnetosphere increase speed. Energized solar winds interact with the Earth’s geomagnetic field causing the Aurora Borealis.
Brainstorming and Prototyping
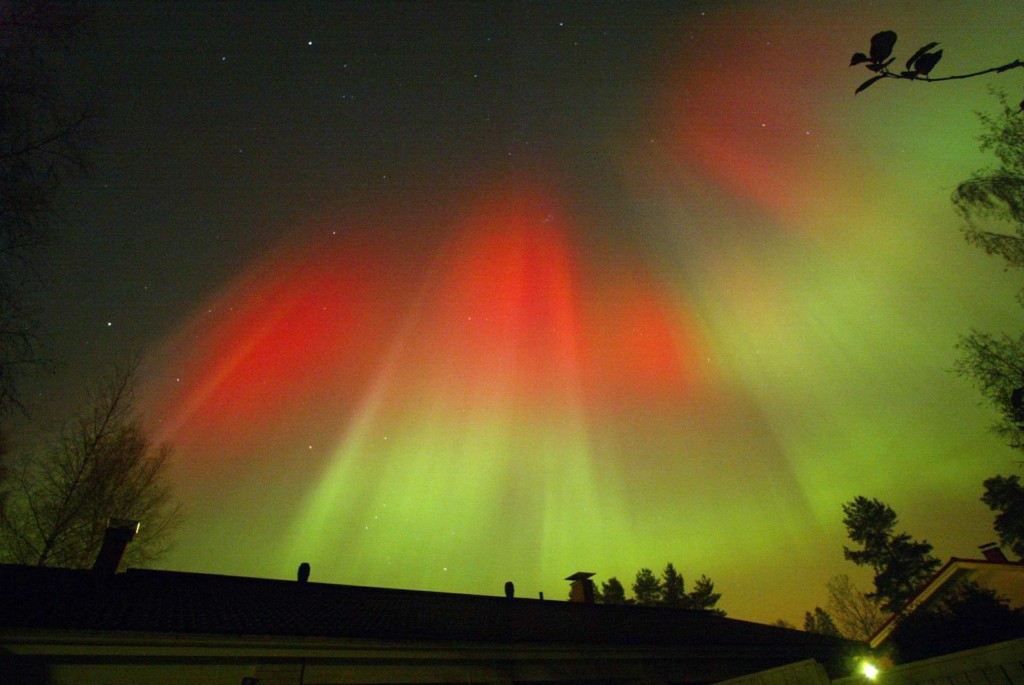
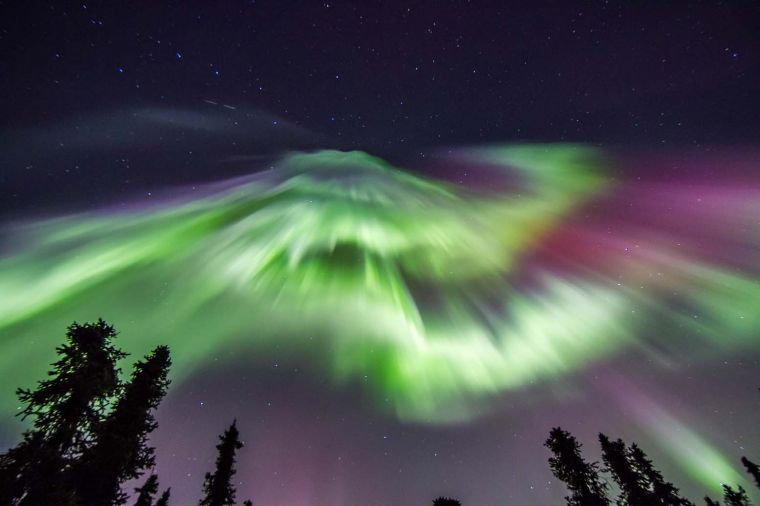
Visual Inspiration: Visualizations—specifically developed by the NASA Scientific Visualization Studio—and photos of geomagnetic storm elements served as critical visual research.
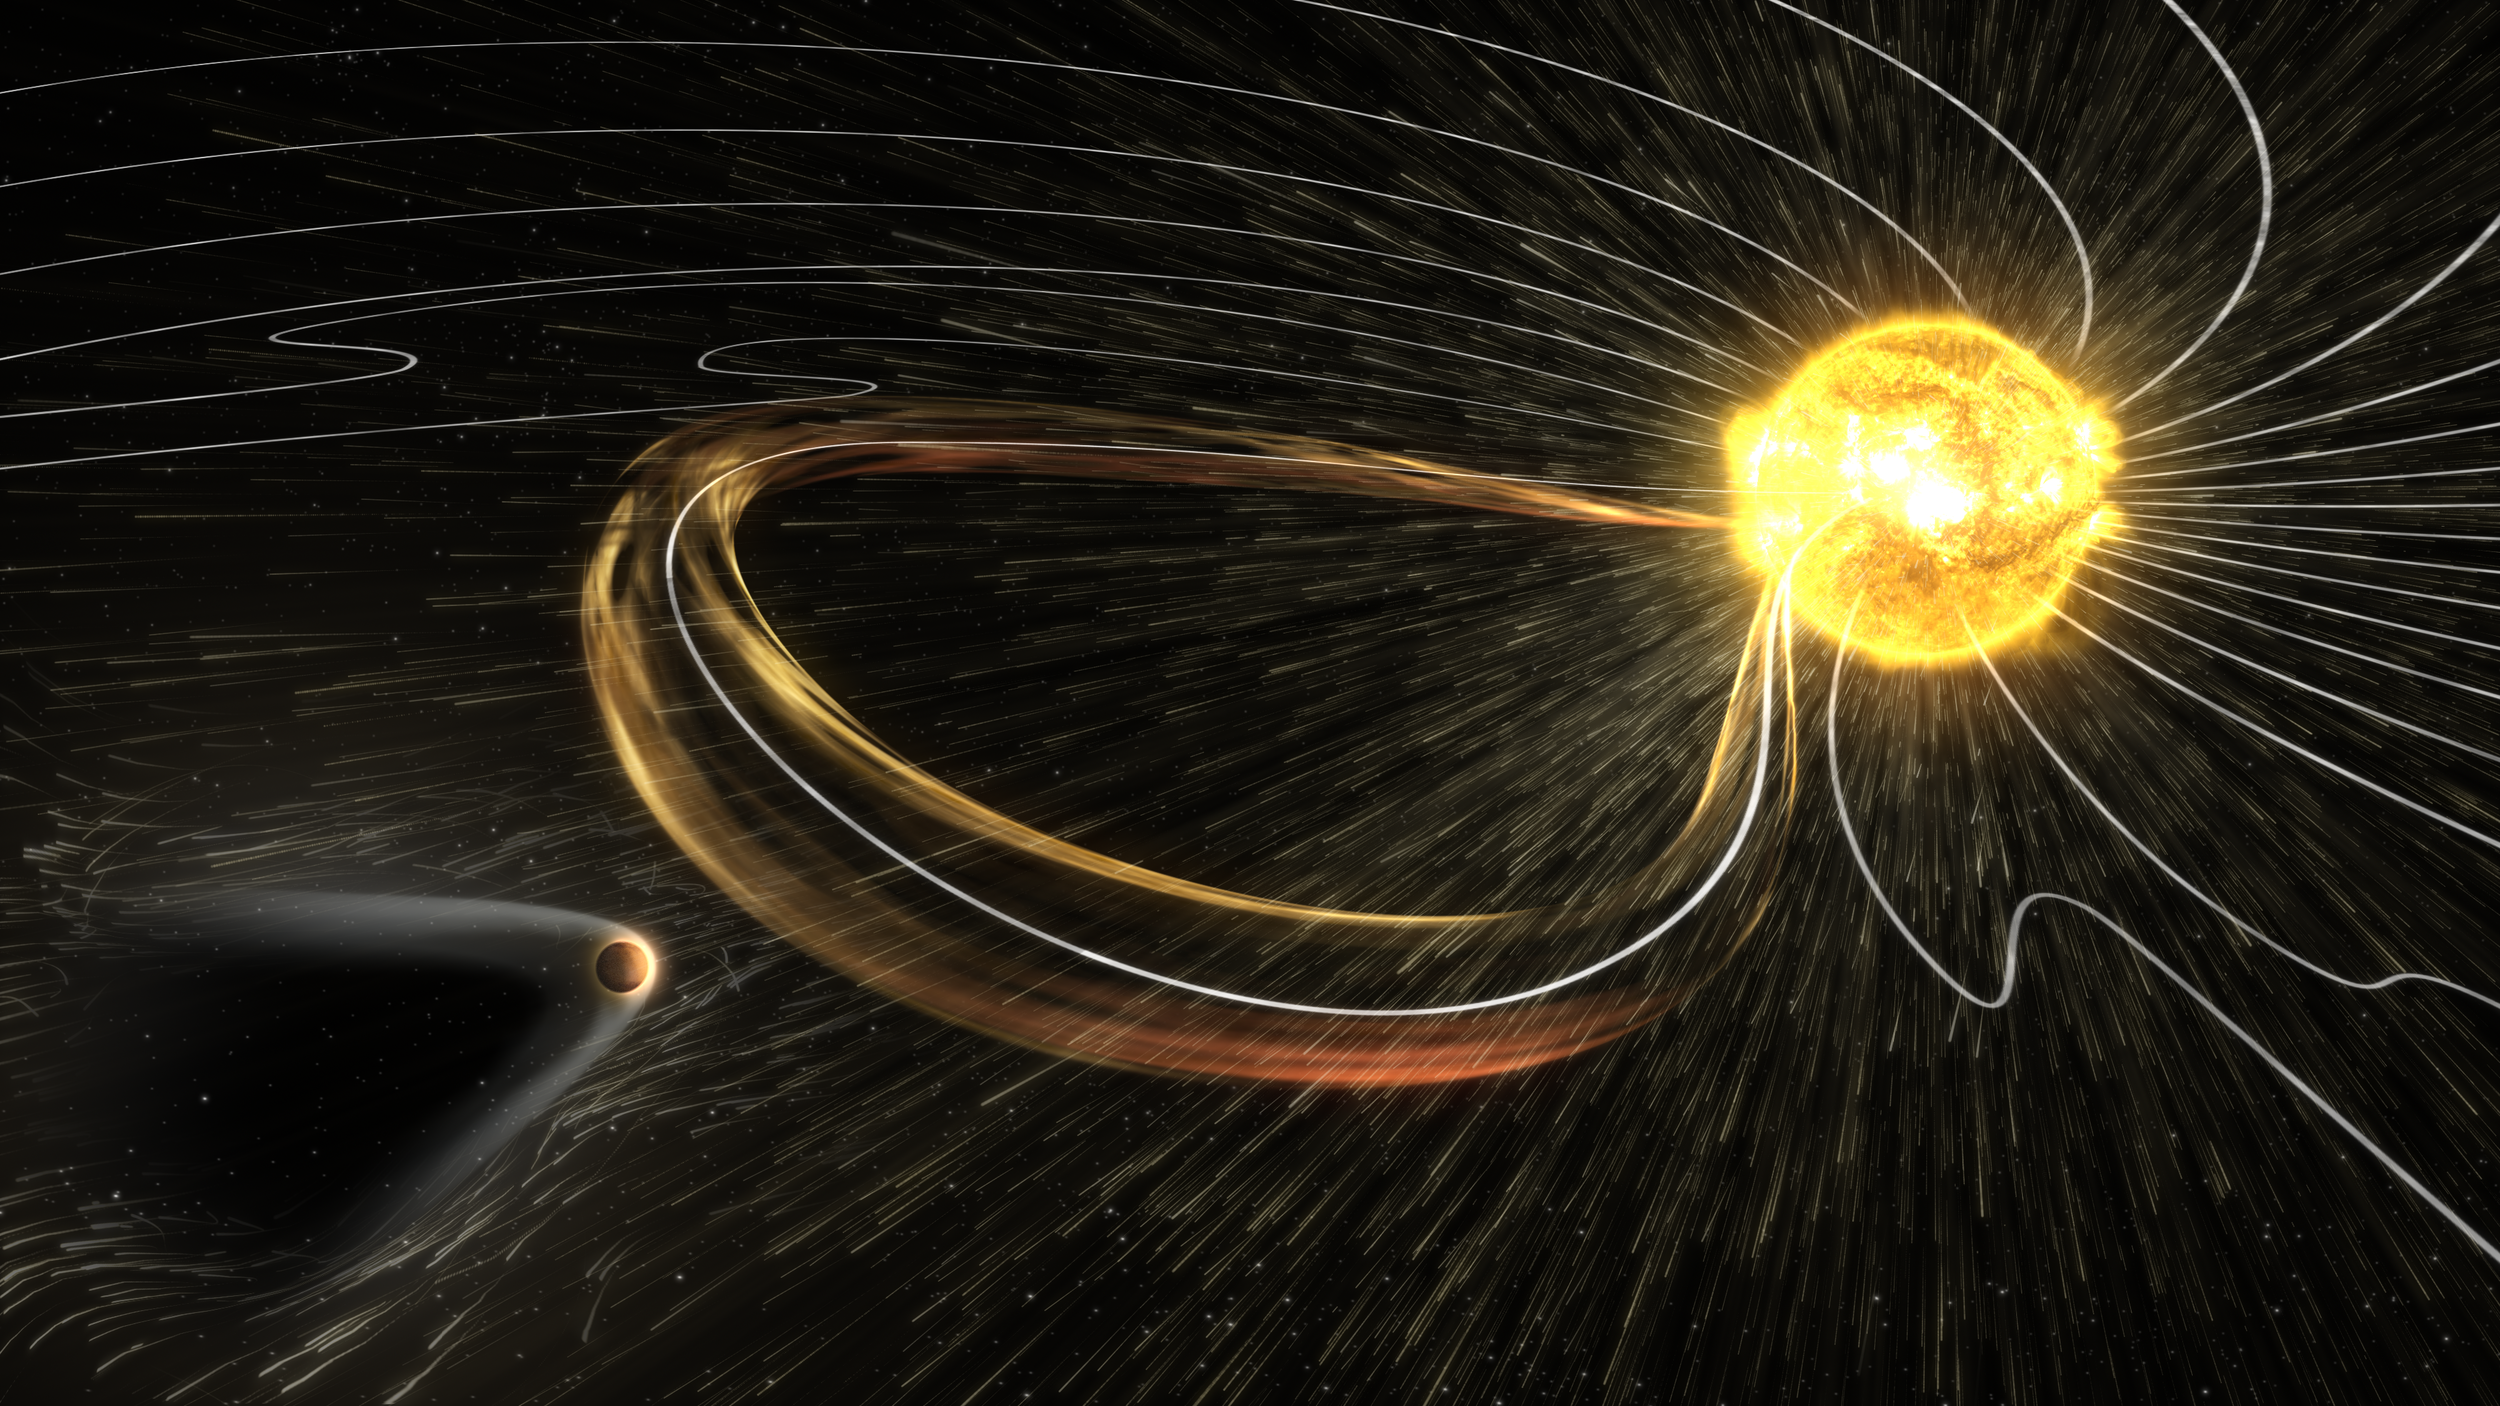
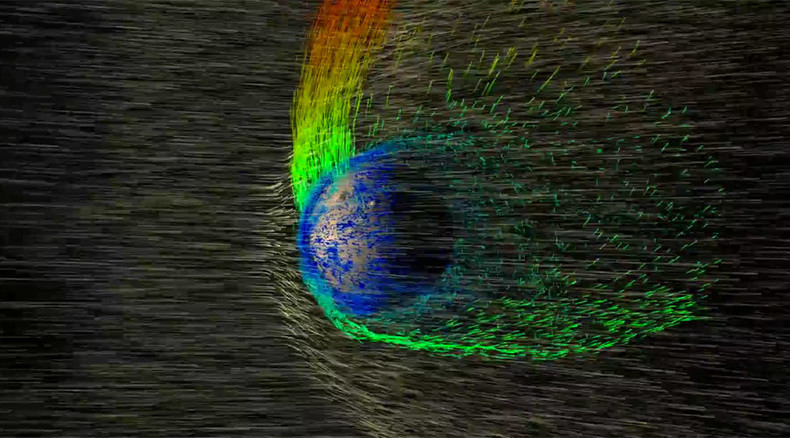
Form Representation: I experimented with how to represent the geomagnetic storm elements and their interaction through form and color. I borrowed from the visual language established in scientific visualizations yet also gave myself the liberty to artistically convey the phenomenon.
![[Untitled] (10).png](https://images.squarespace-cdn.com/content/v1/597e6796a5790a1f46ac8ebc/1550444371469-FN5B9AKGWV2MWO64GM23/%5BUntitled%5D+%2810%29.png)
![[Untitled] (9).png](https://images.squarespace-cdn.com/content/v1/597e6796a5790a1f46ac8ebc/1550444387153-00UET5YDD17AJYDF0YGT/%5BUntitled%5D+%289%29.png)
![[Untitled] (8).png](https://images.squarespace-cdn.com/content/v1/597e6796a5790a1f46ac8ebc/1550444404777-ULMR5H906S80WHQP6FJE/%5BUntitled%5D+%288%29.png)
![[Untitled] (11).png](https://images.squarespace-cdn.com/content/v1/597e6796a5790a1f46ac8ebc/1550444415622-AA74JPDD1VJKCBUNAE9Z/%5BUntitled%5D+%2811%29.png)
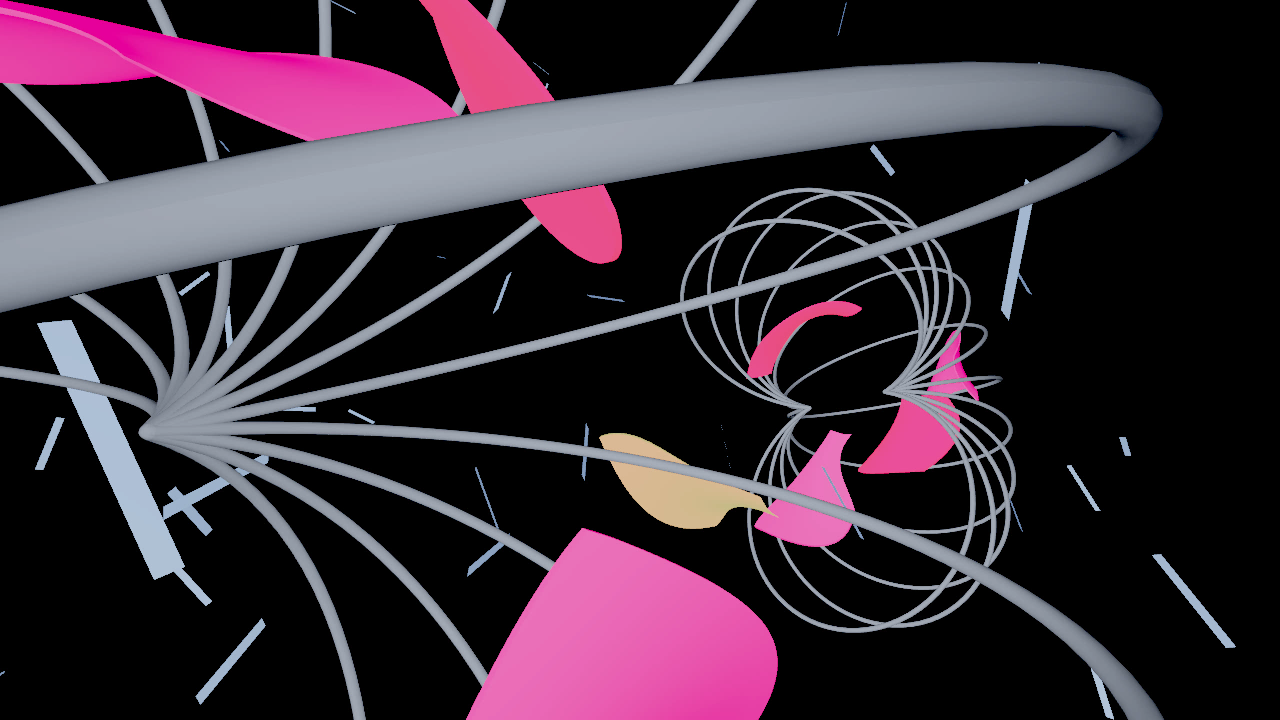
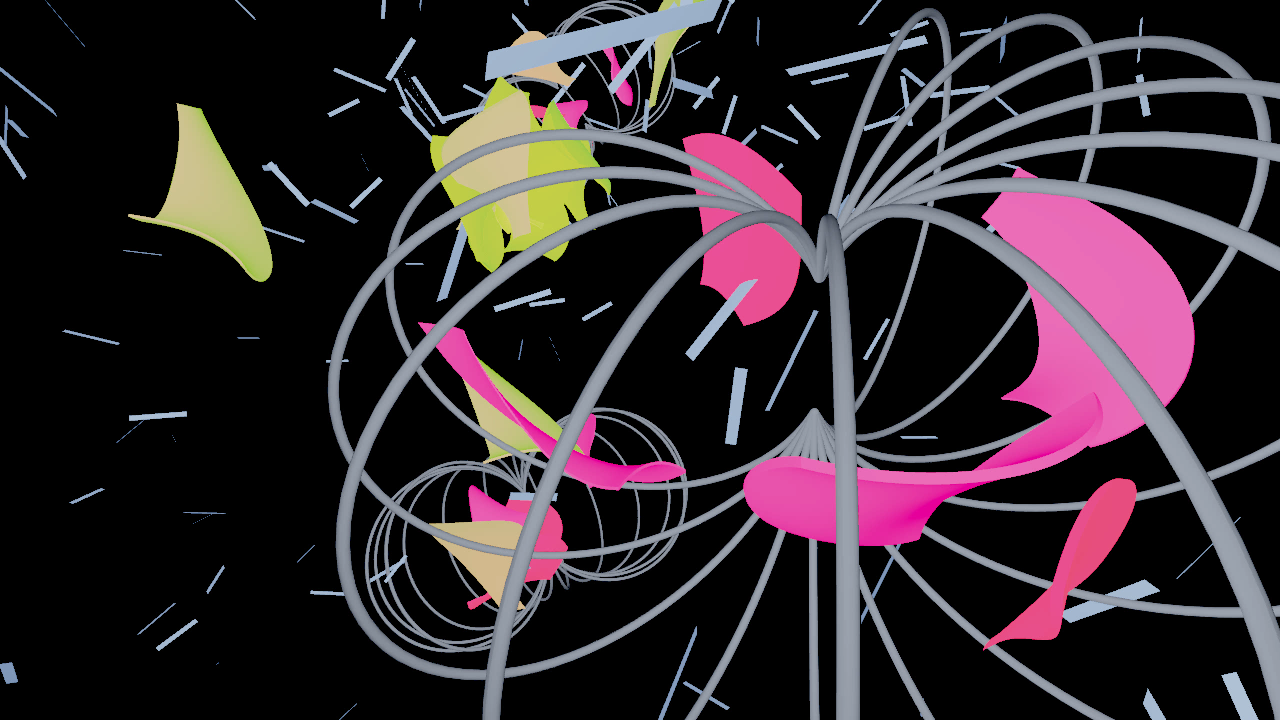
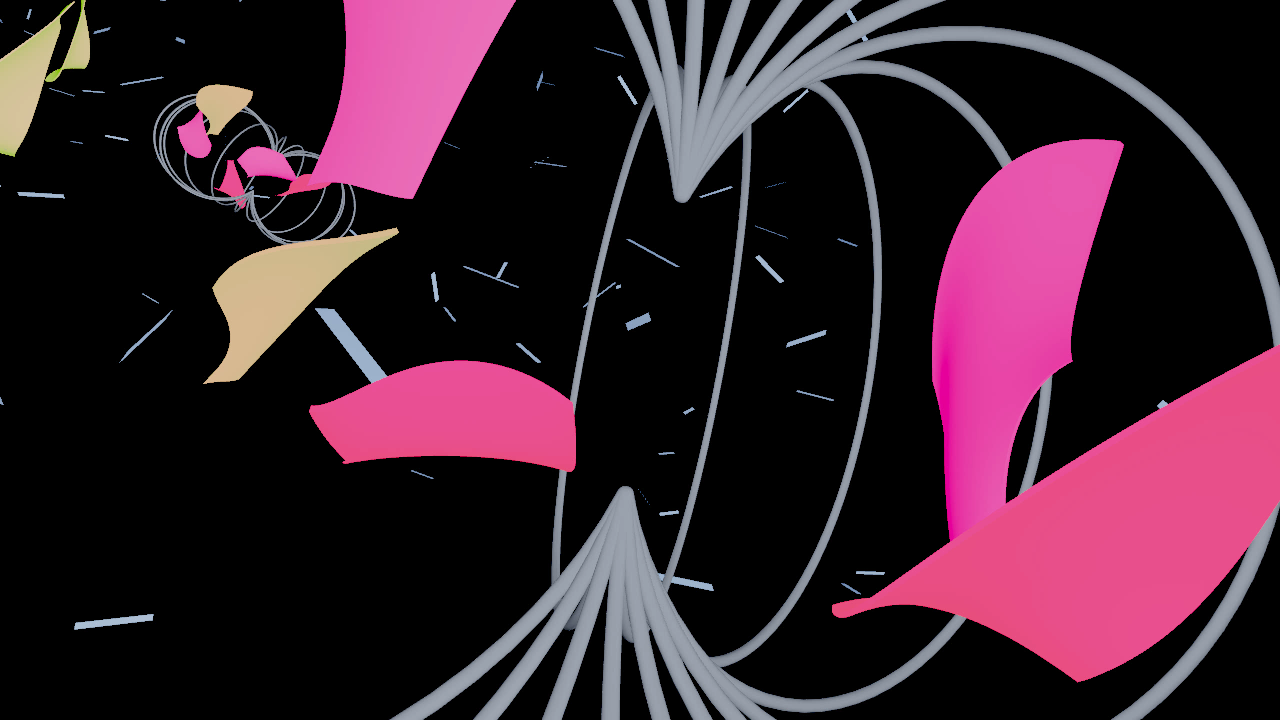
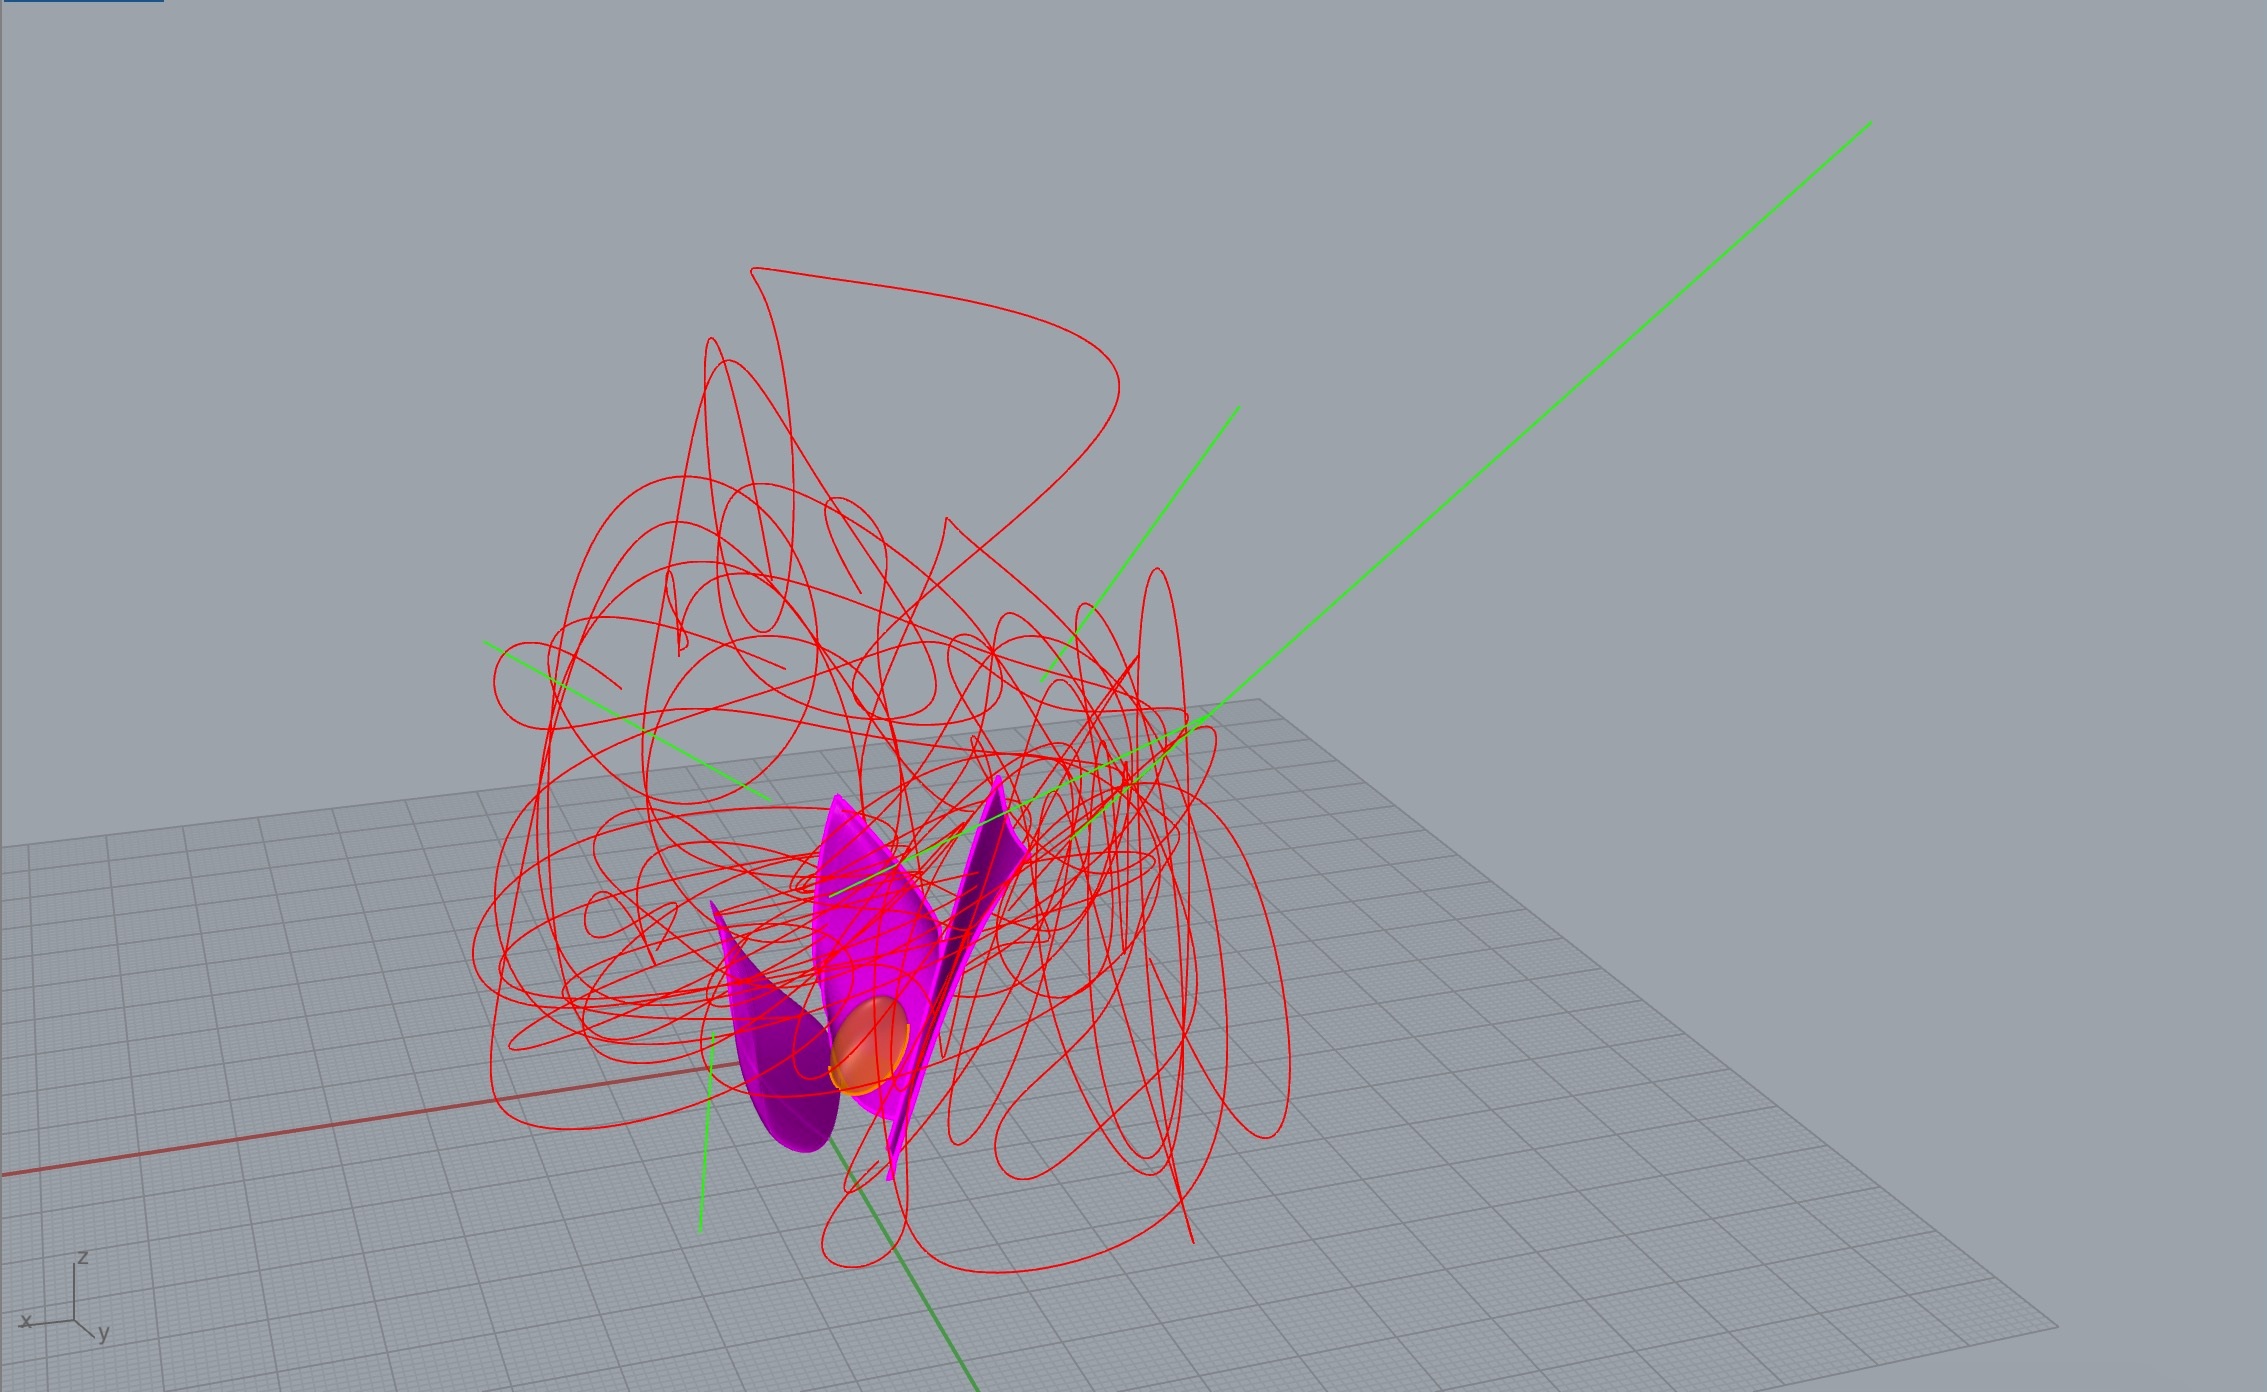
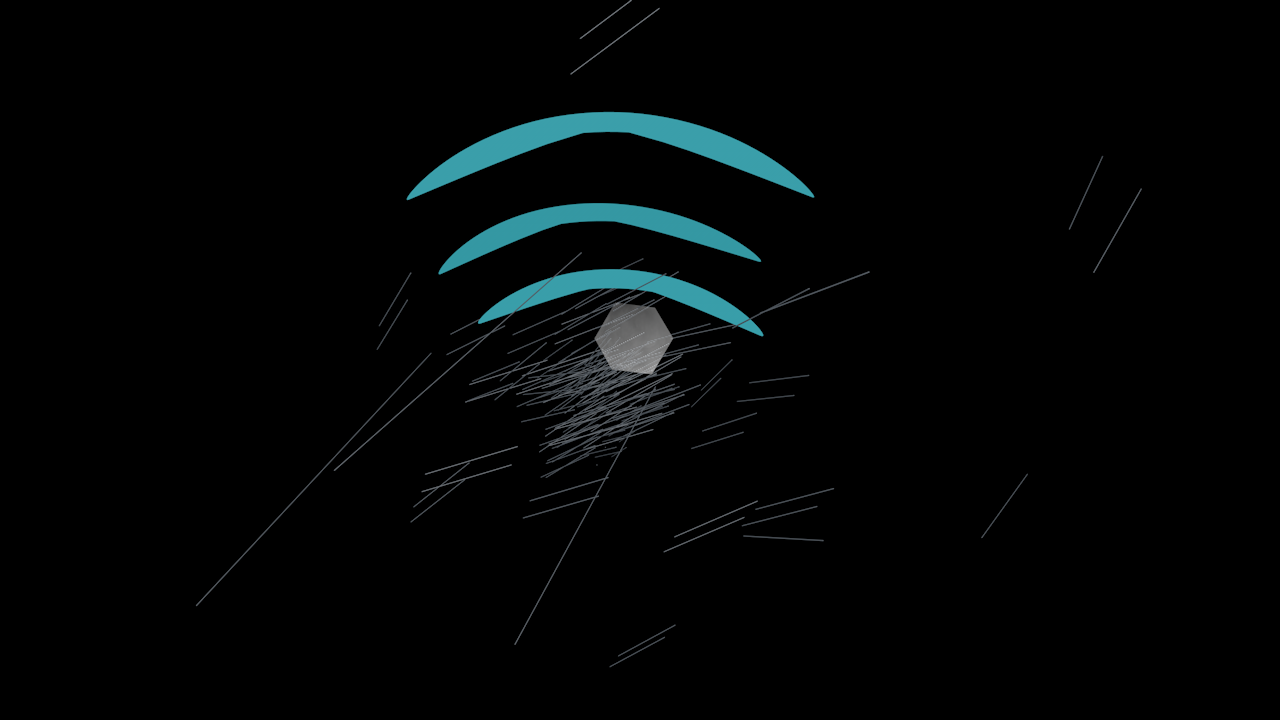
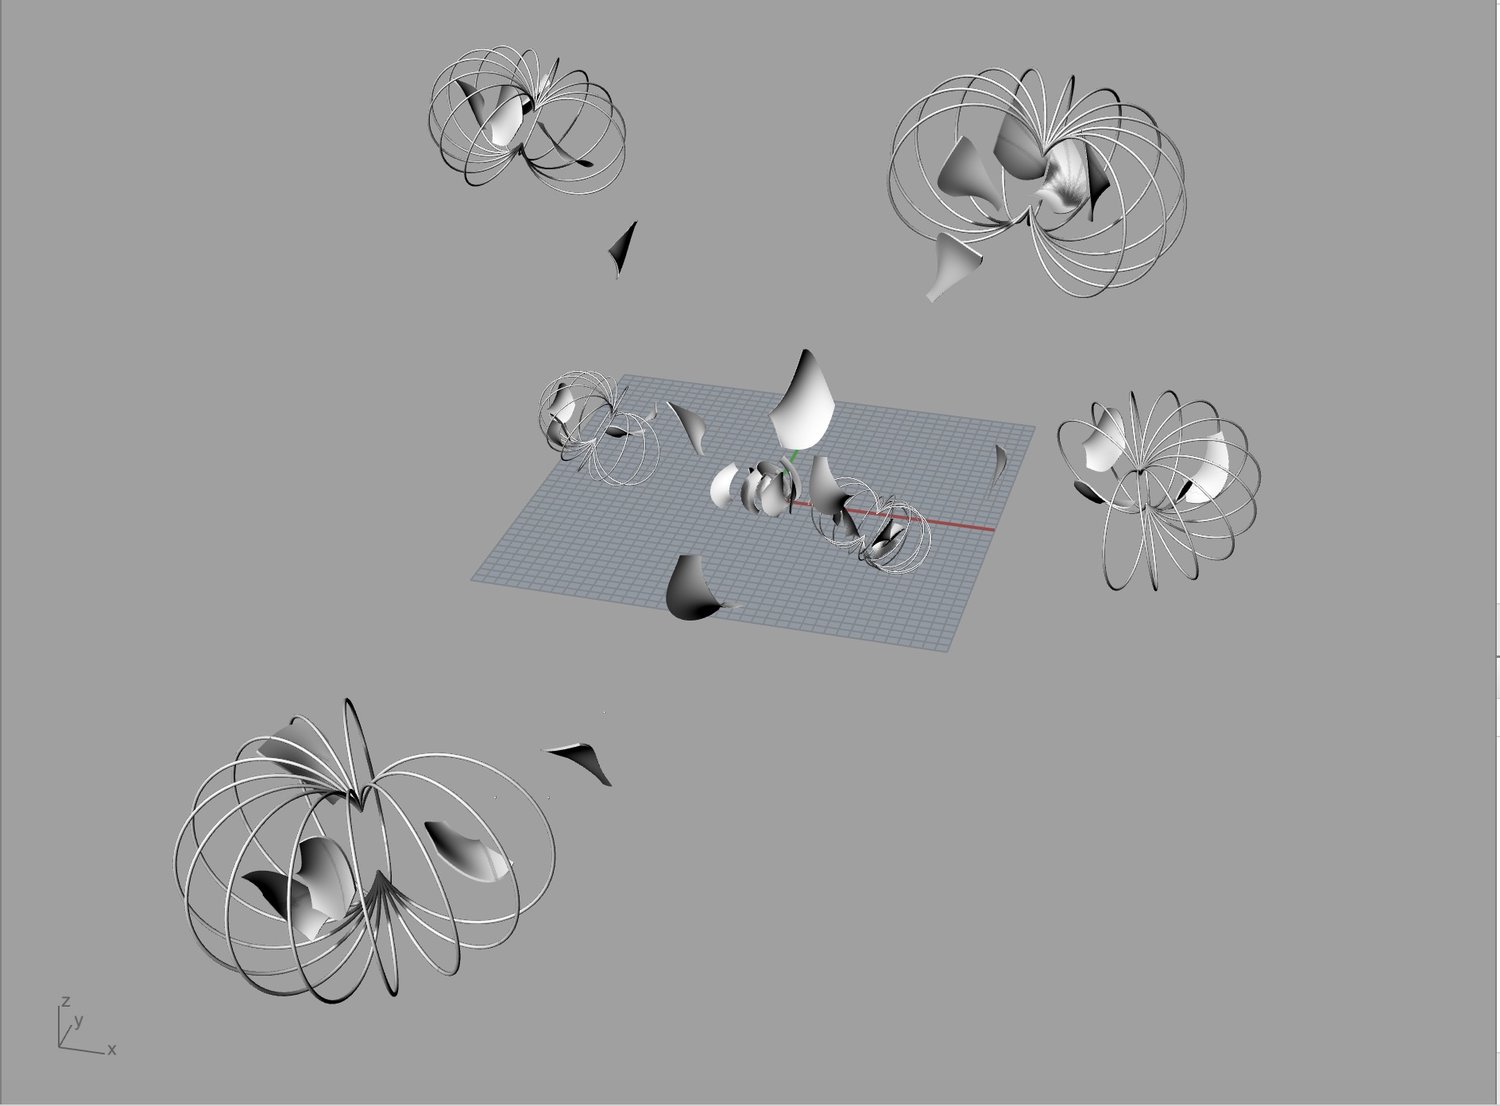
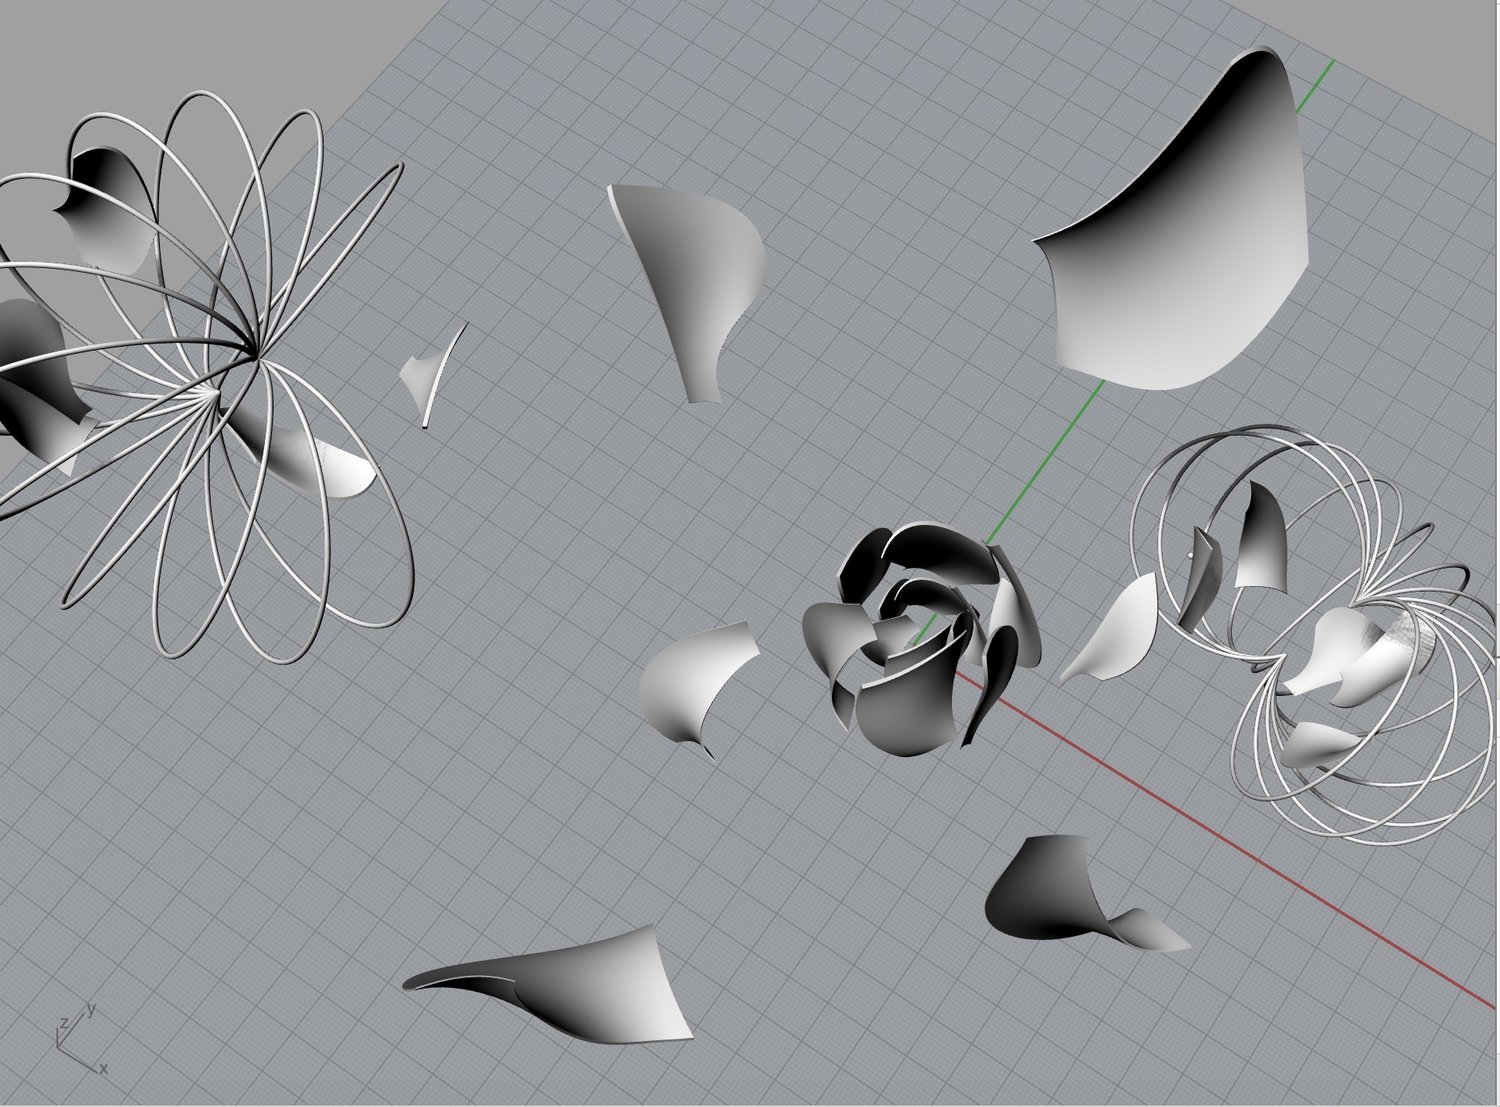
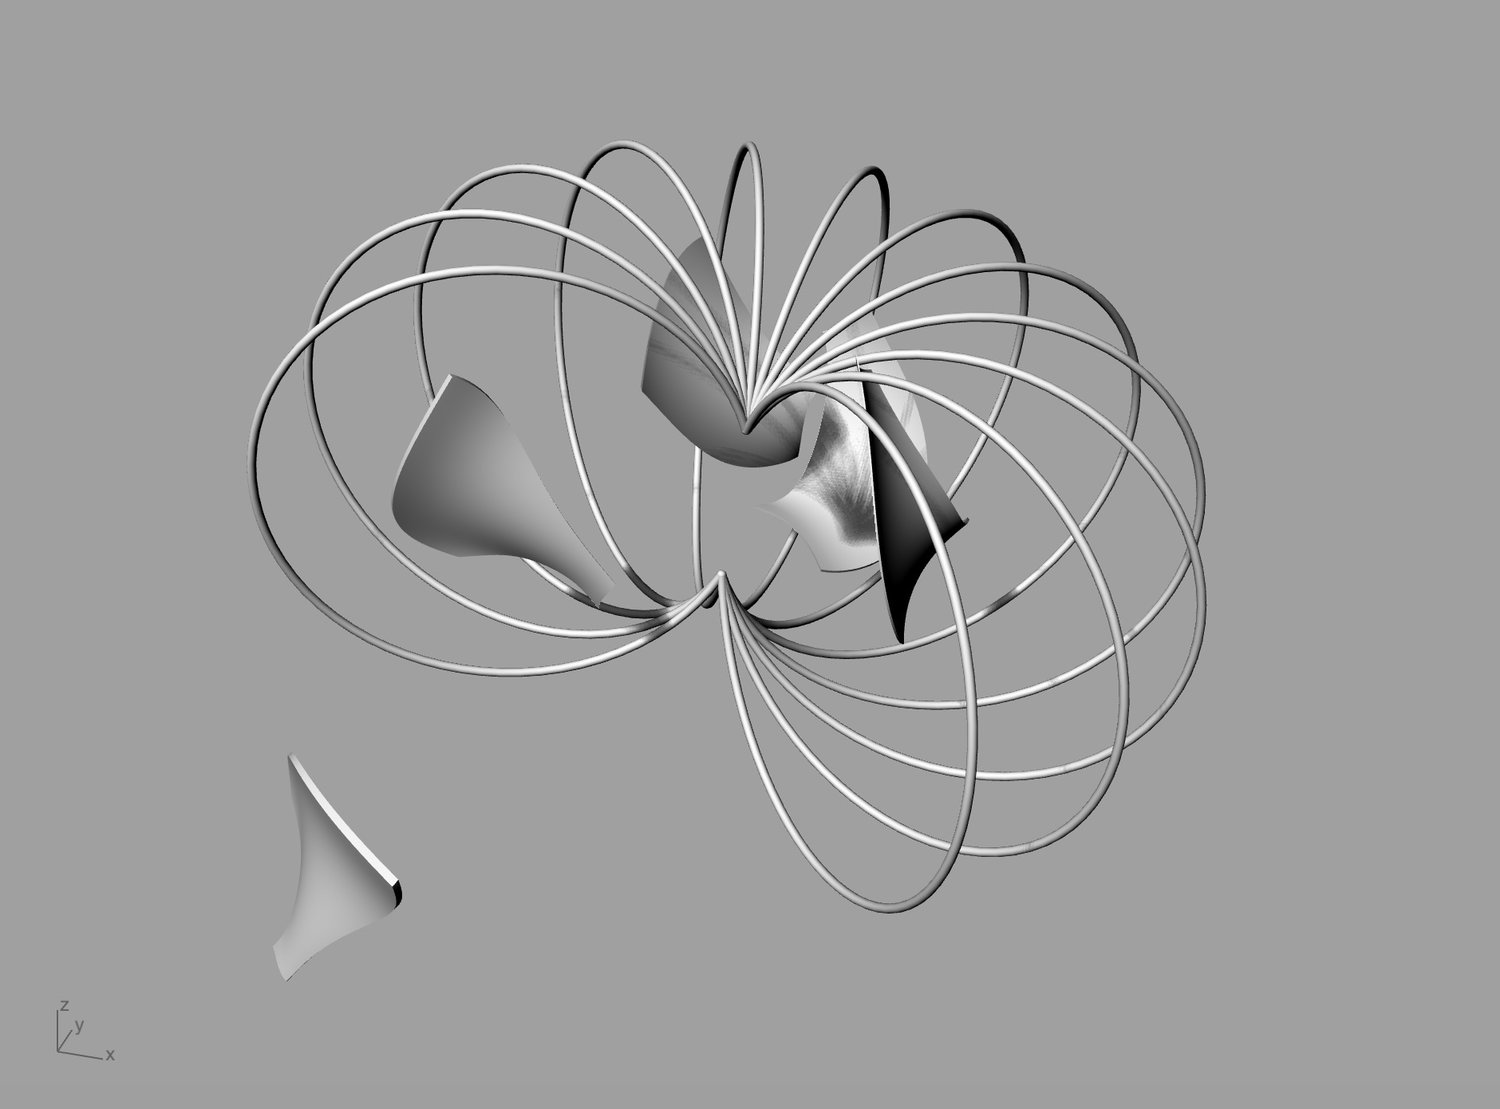
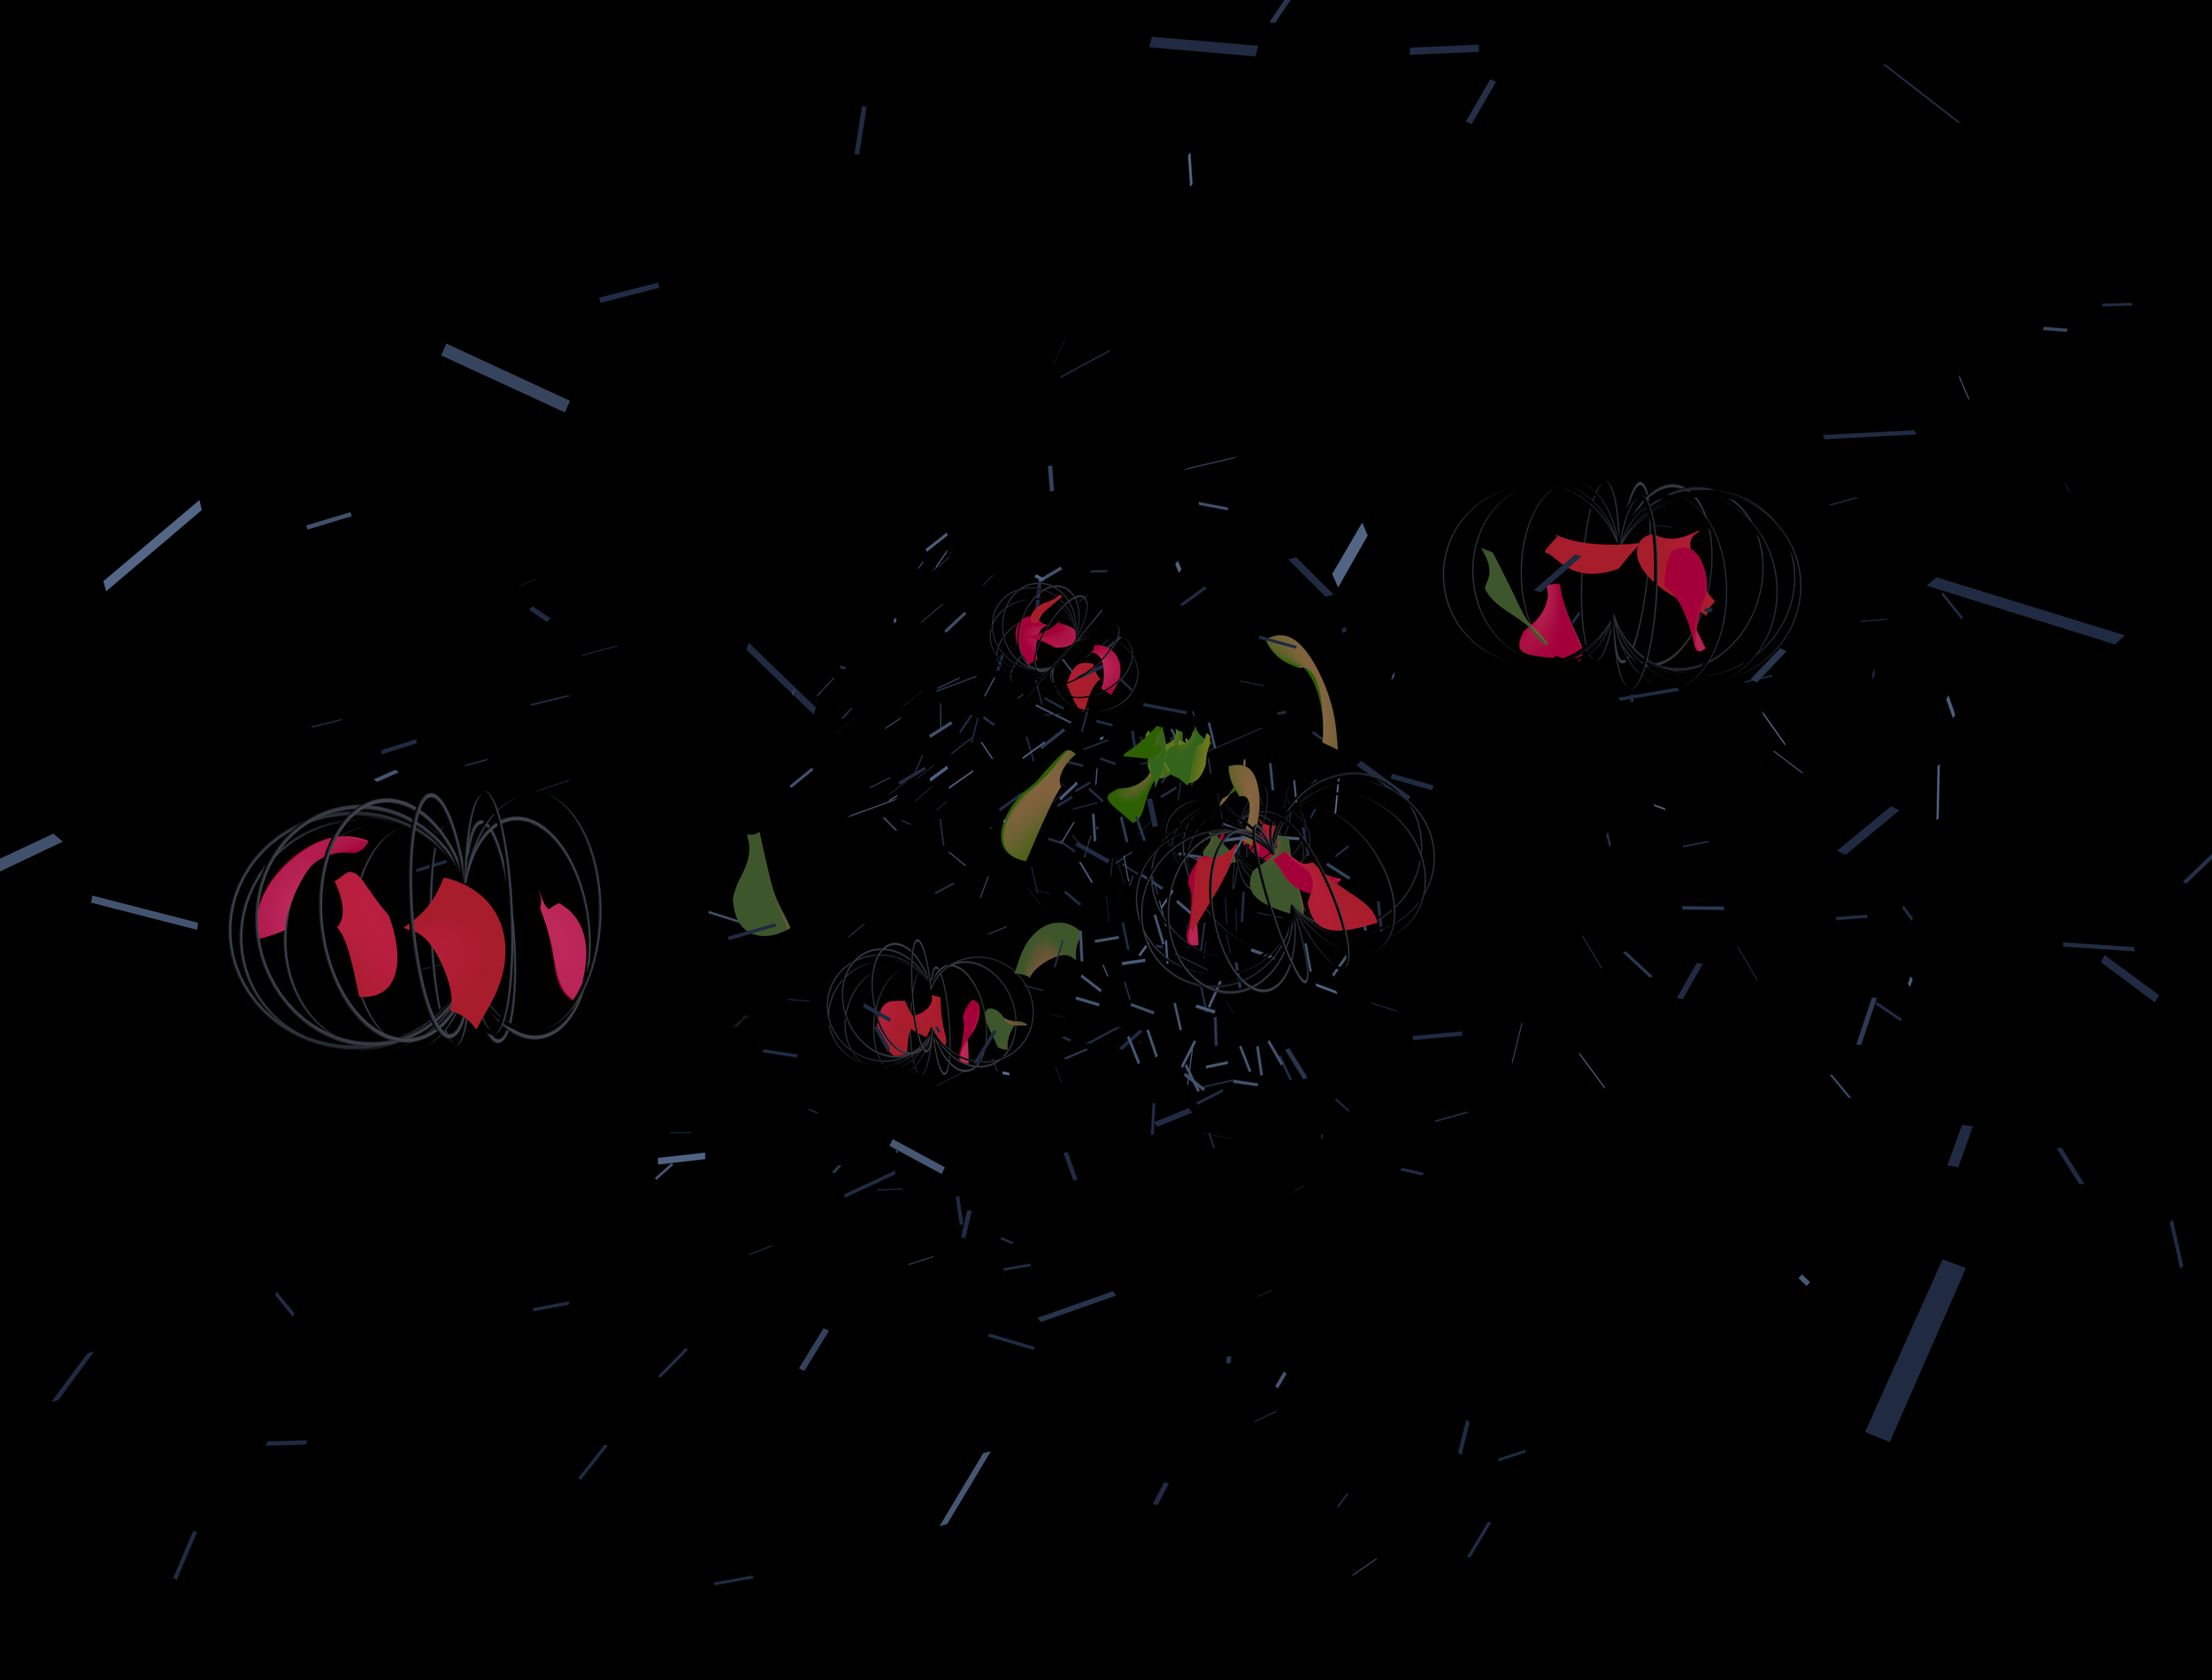
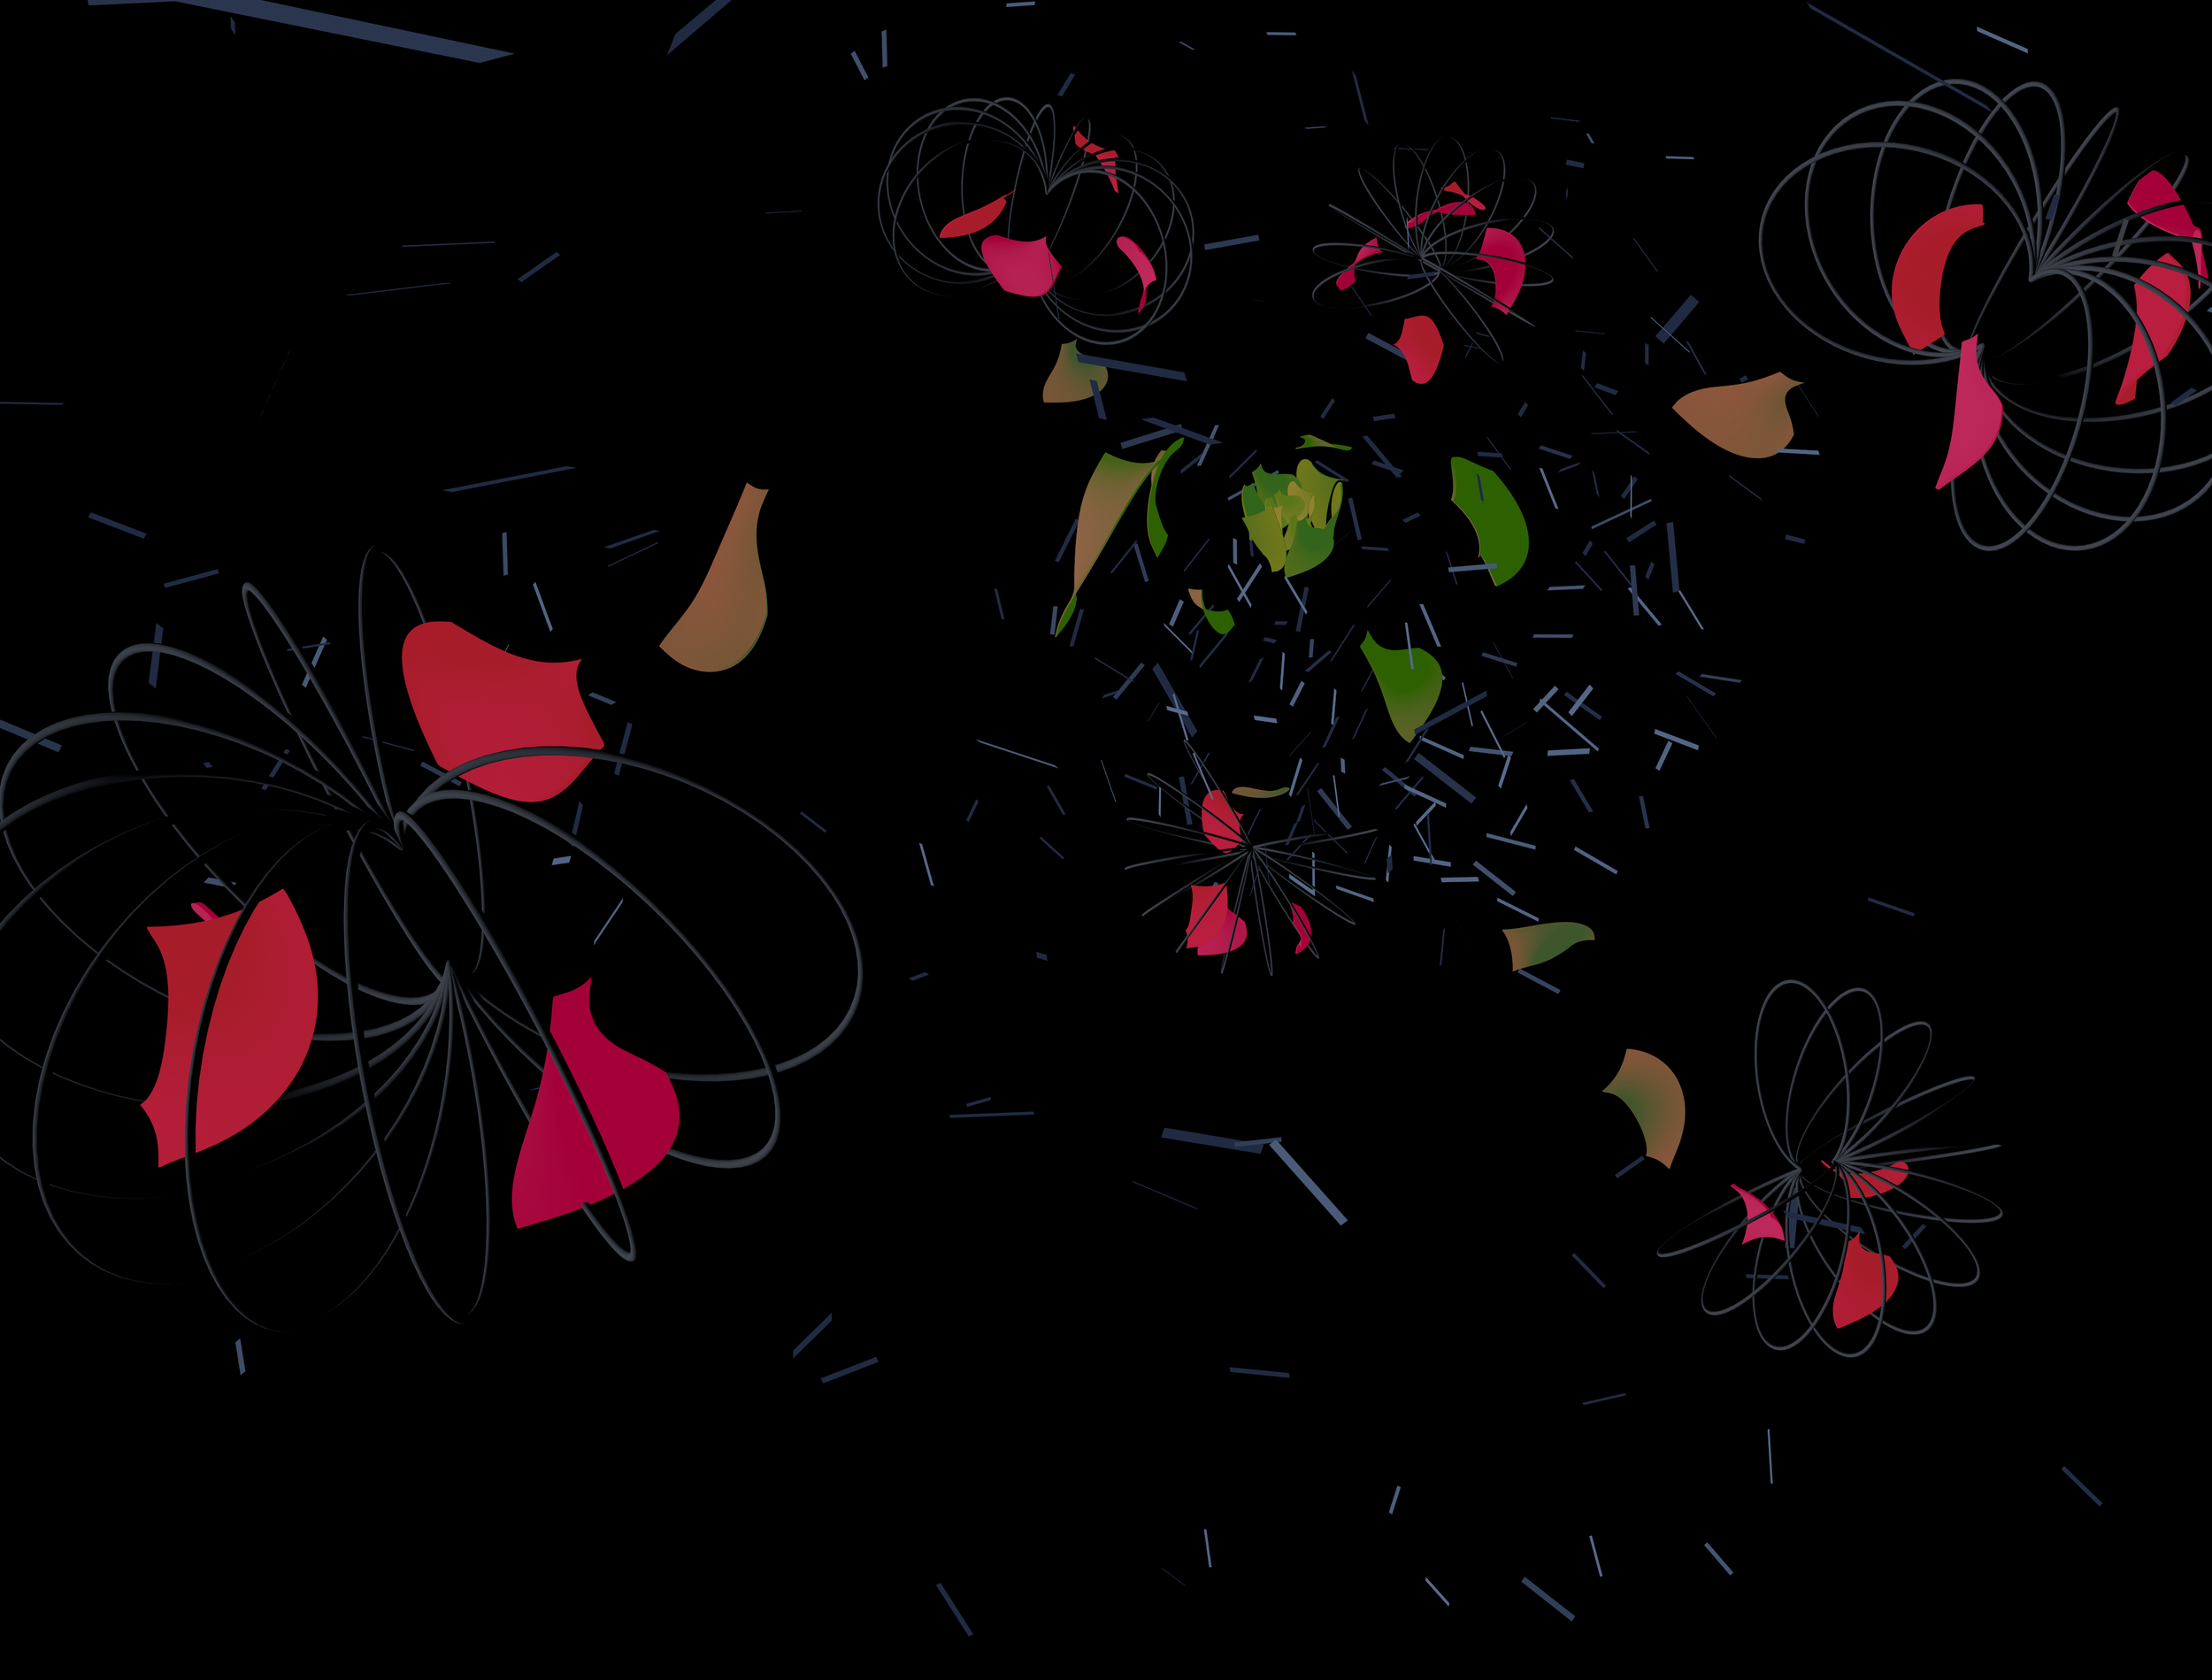
Early Models: Purely to explore form, I used Rhino and Cinema4D to visualize the interplay between the solar winds, geomagnetic fields, and aurora borealis. The models follow a circular, inward progression in which the solar winds overlap with the geomagnetic fields and the aurora borealis is placed in the center.
First Iteration
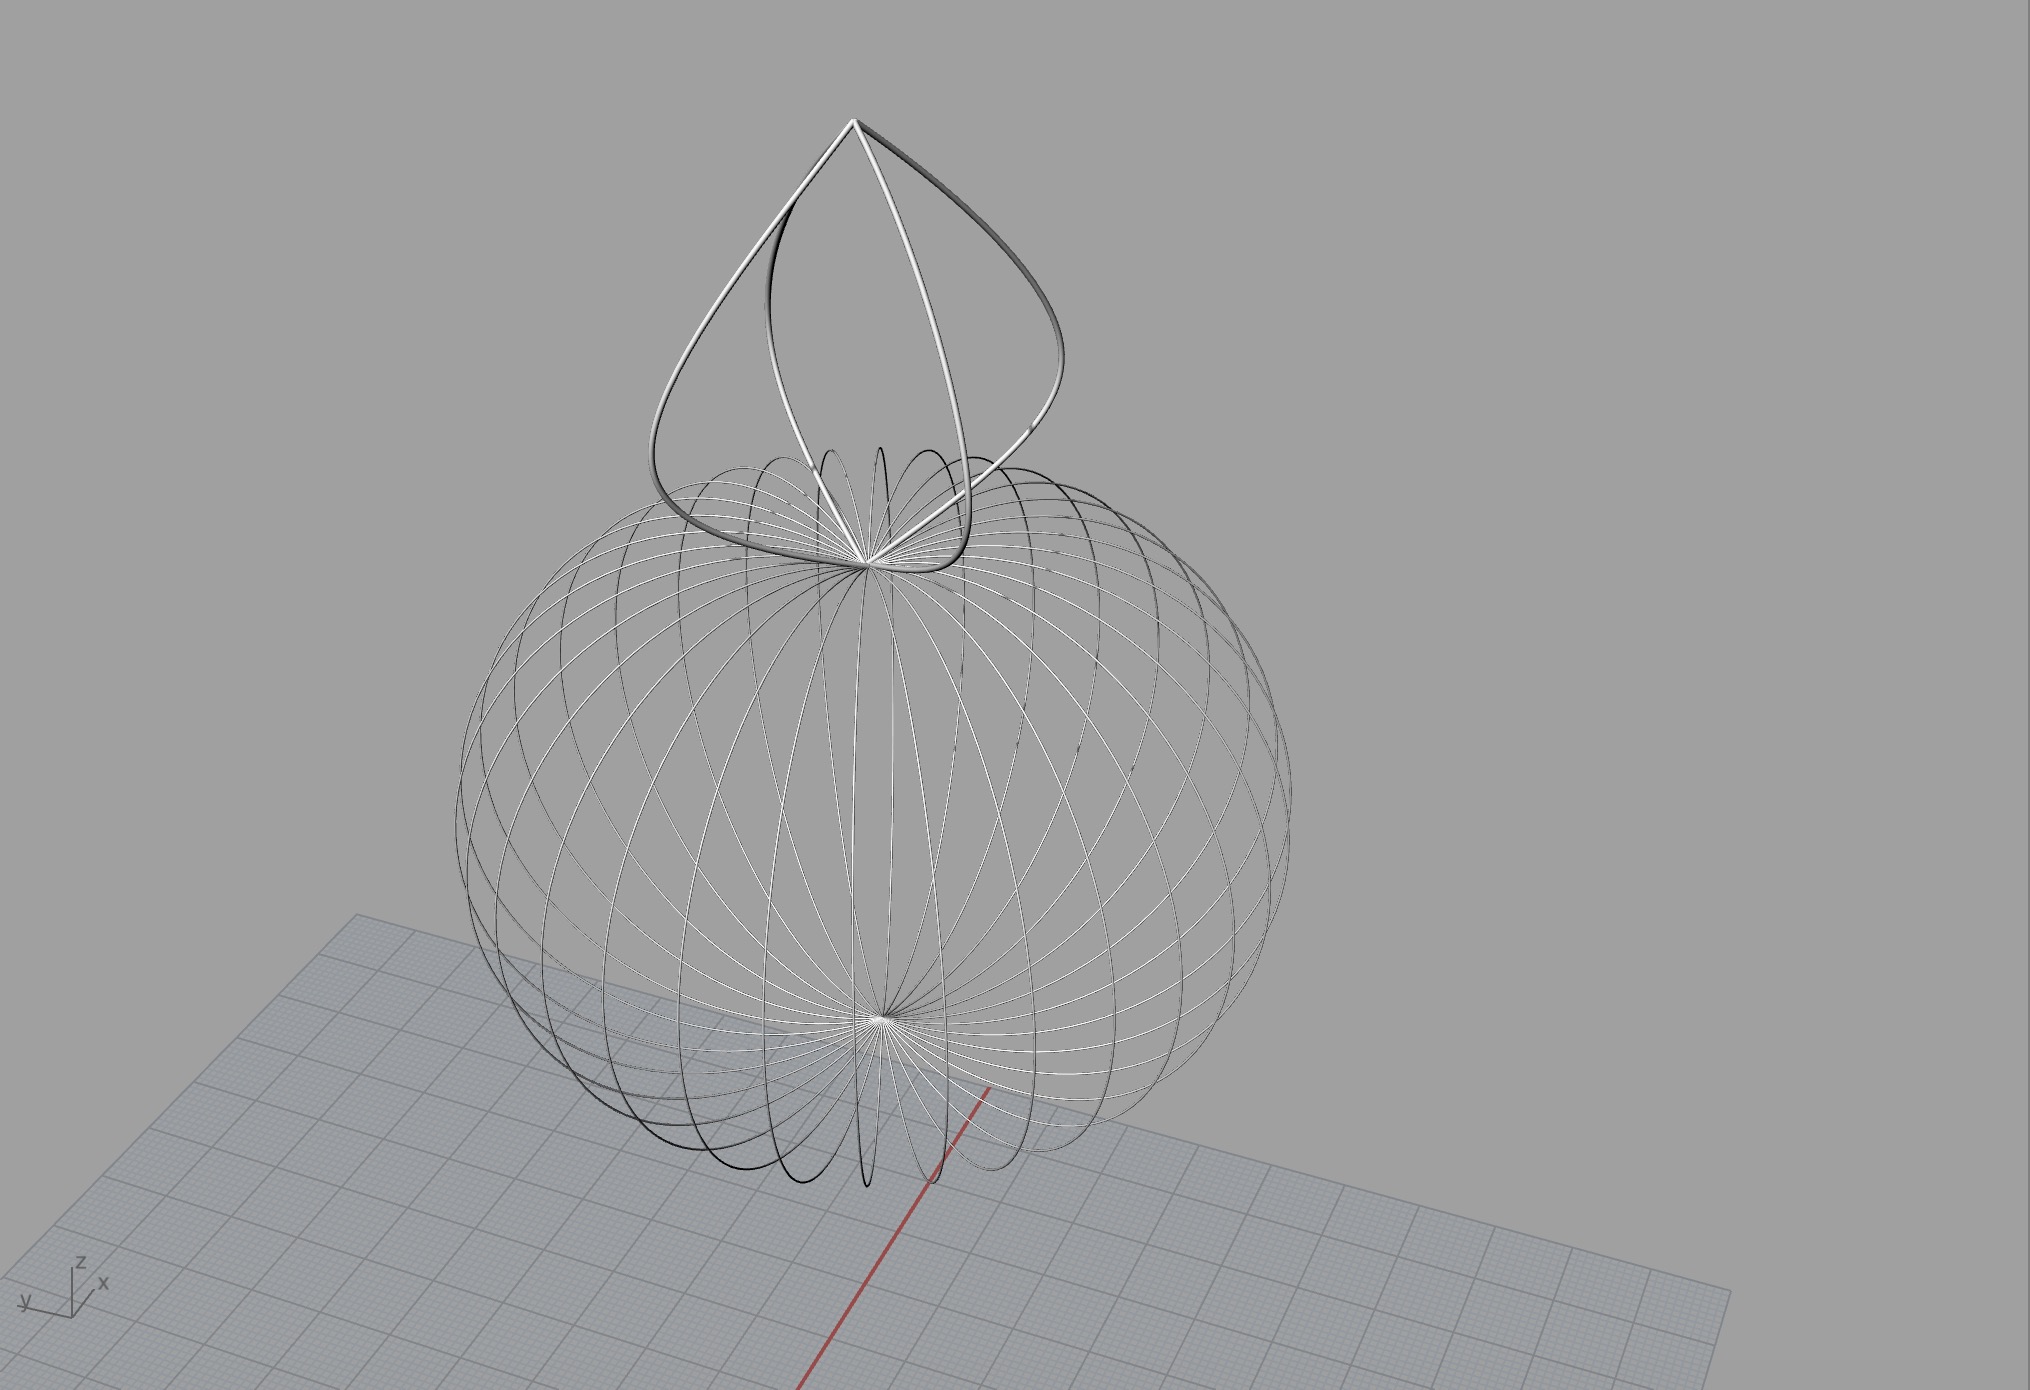
Form Decisions: Modeled in Rhino, the first iteration contains the geomagnetic fields and Aurora Borealis. The forms for both components are based upon my early explorations as well as scientific visualizations.
The geomagnetic field highlights the magnetic reconnection process—direct cause of the Aurora Borealis—when the pipes are joined together in the upper half of the model. The aurora borealis is the culmination of the geomagnetic storm. Thus, a flowering aurora borealis sits in between the two halves of the geomagnetic field and planar forms from the aurora gradually fall off.
Feedback: My fellow resident and I agreed that the geomagnetic fields and aurora borealis forms represented the natural phenomenon well. However, we felt that the model was static and could be a limiting VR experience. For the second iteration, I wanted to build more dynamism and spatial depth within the model.
Second Iteration
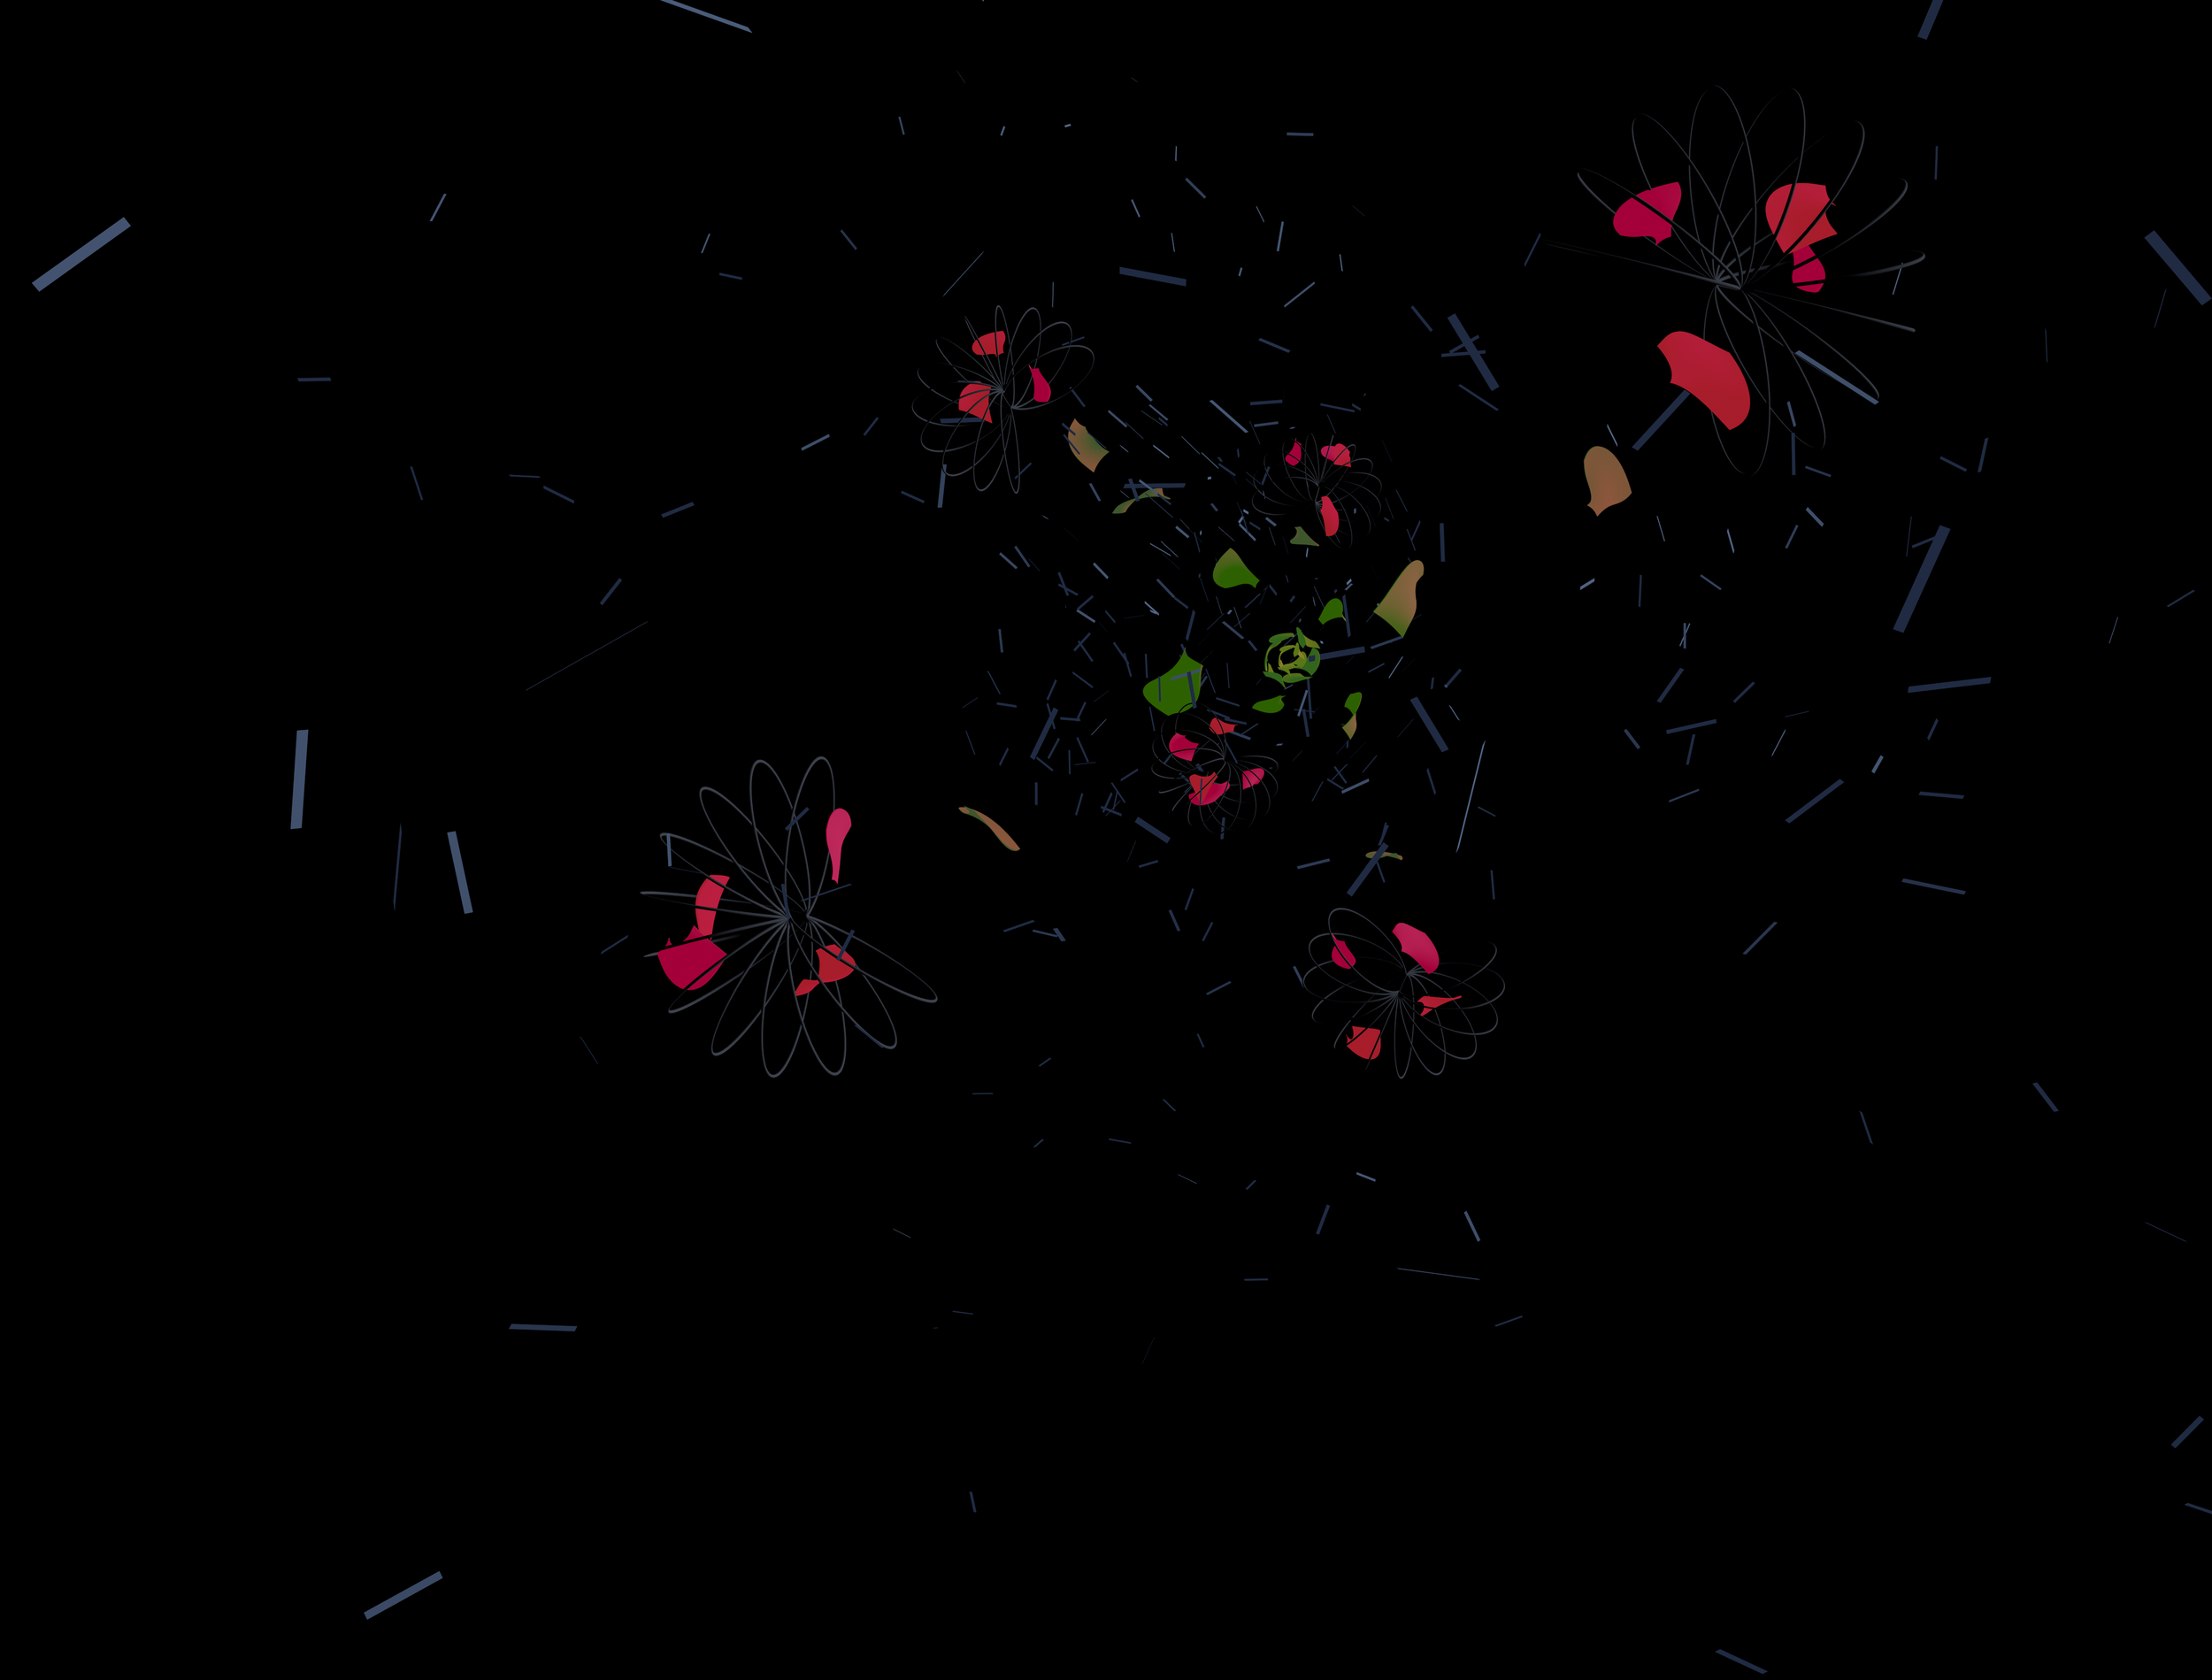
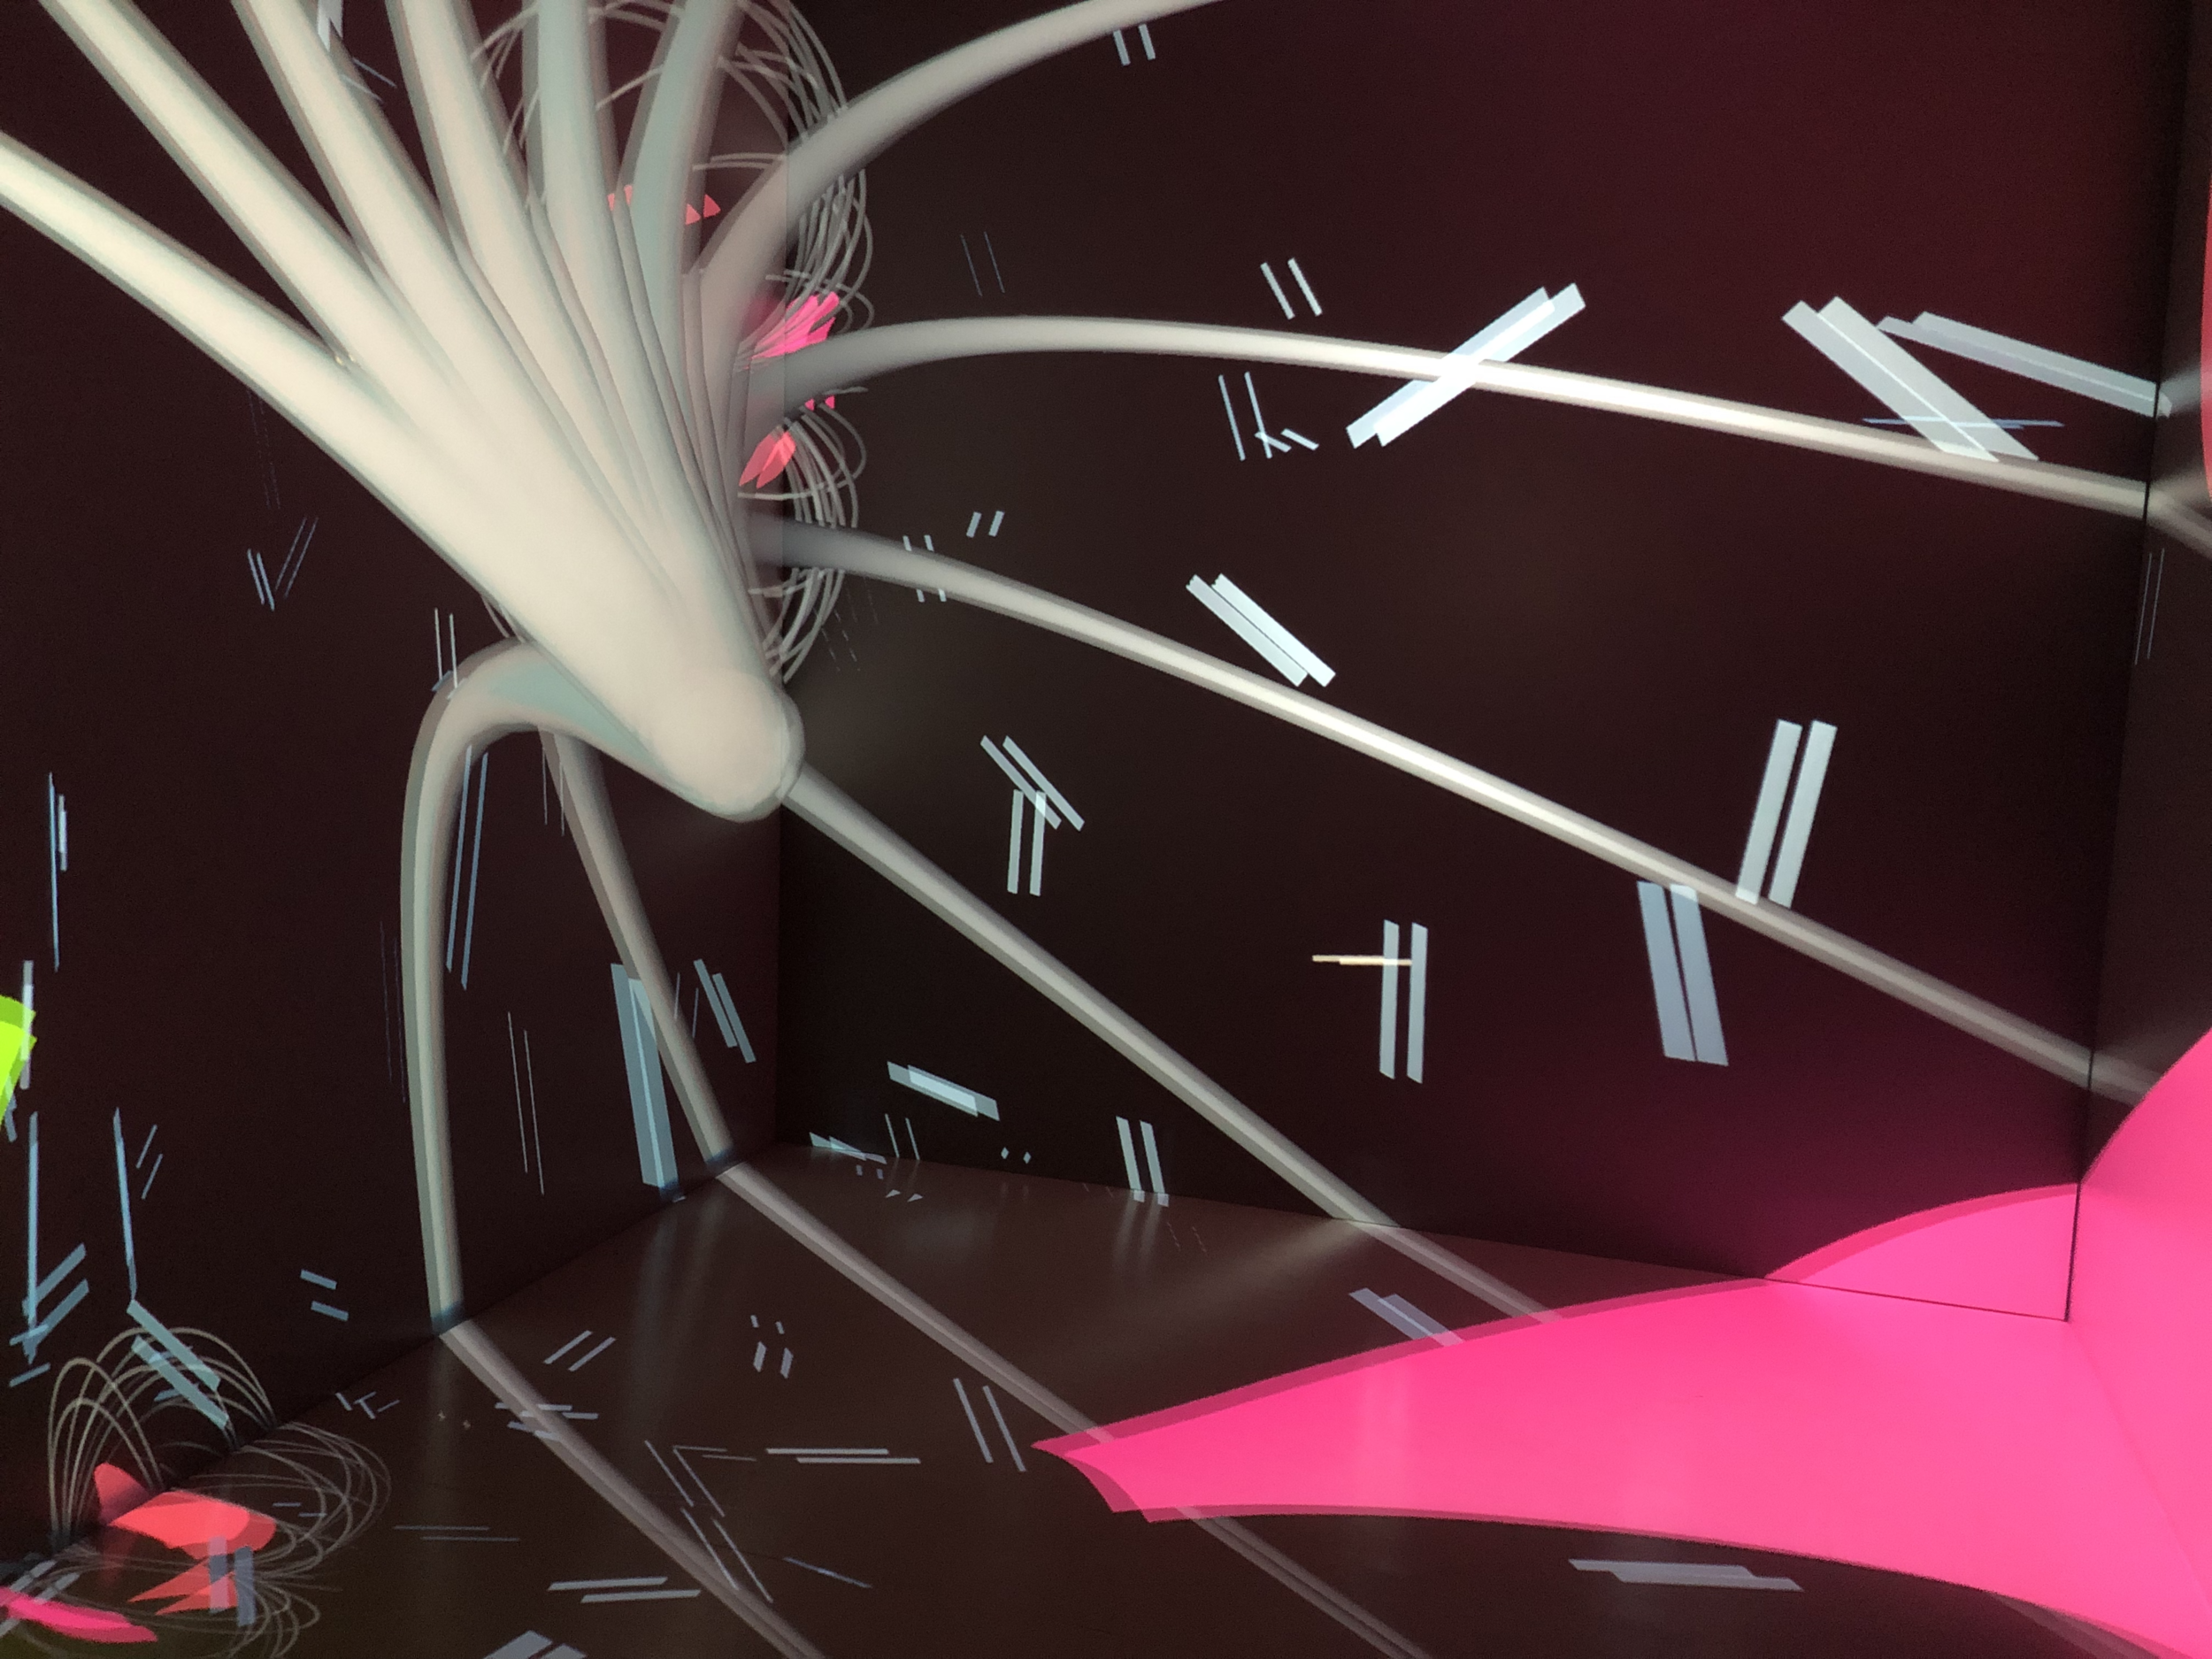
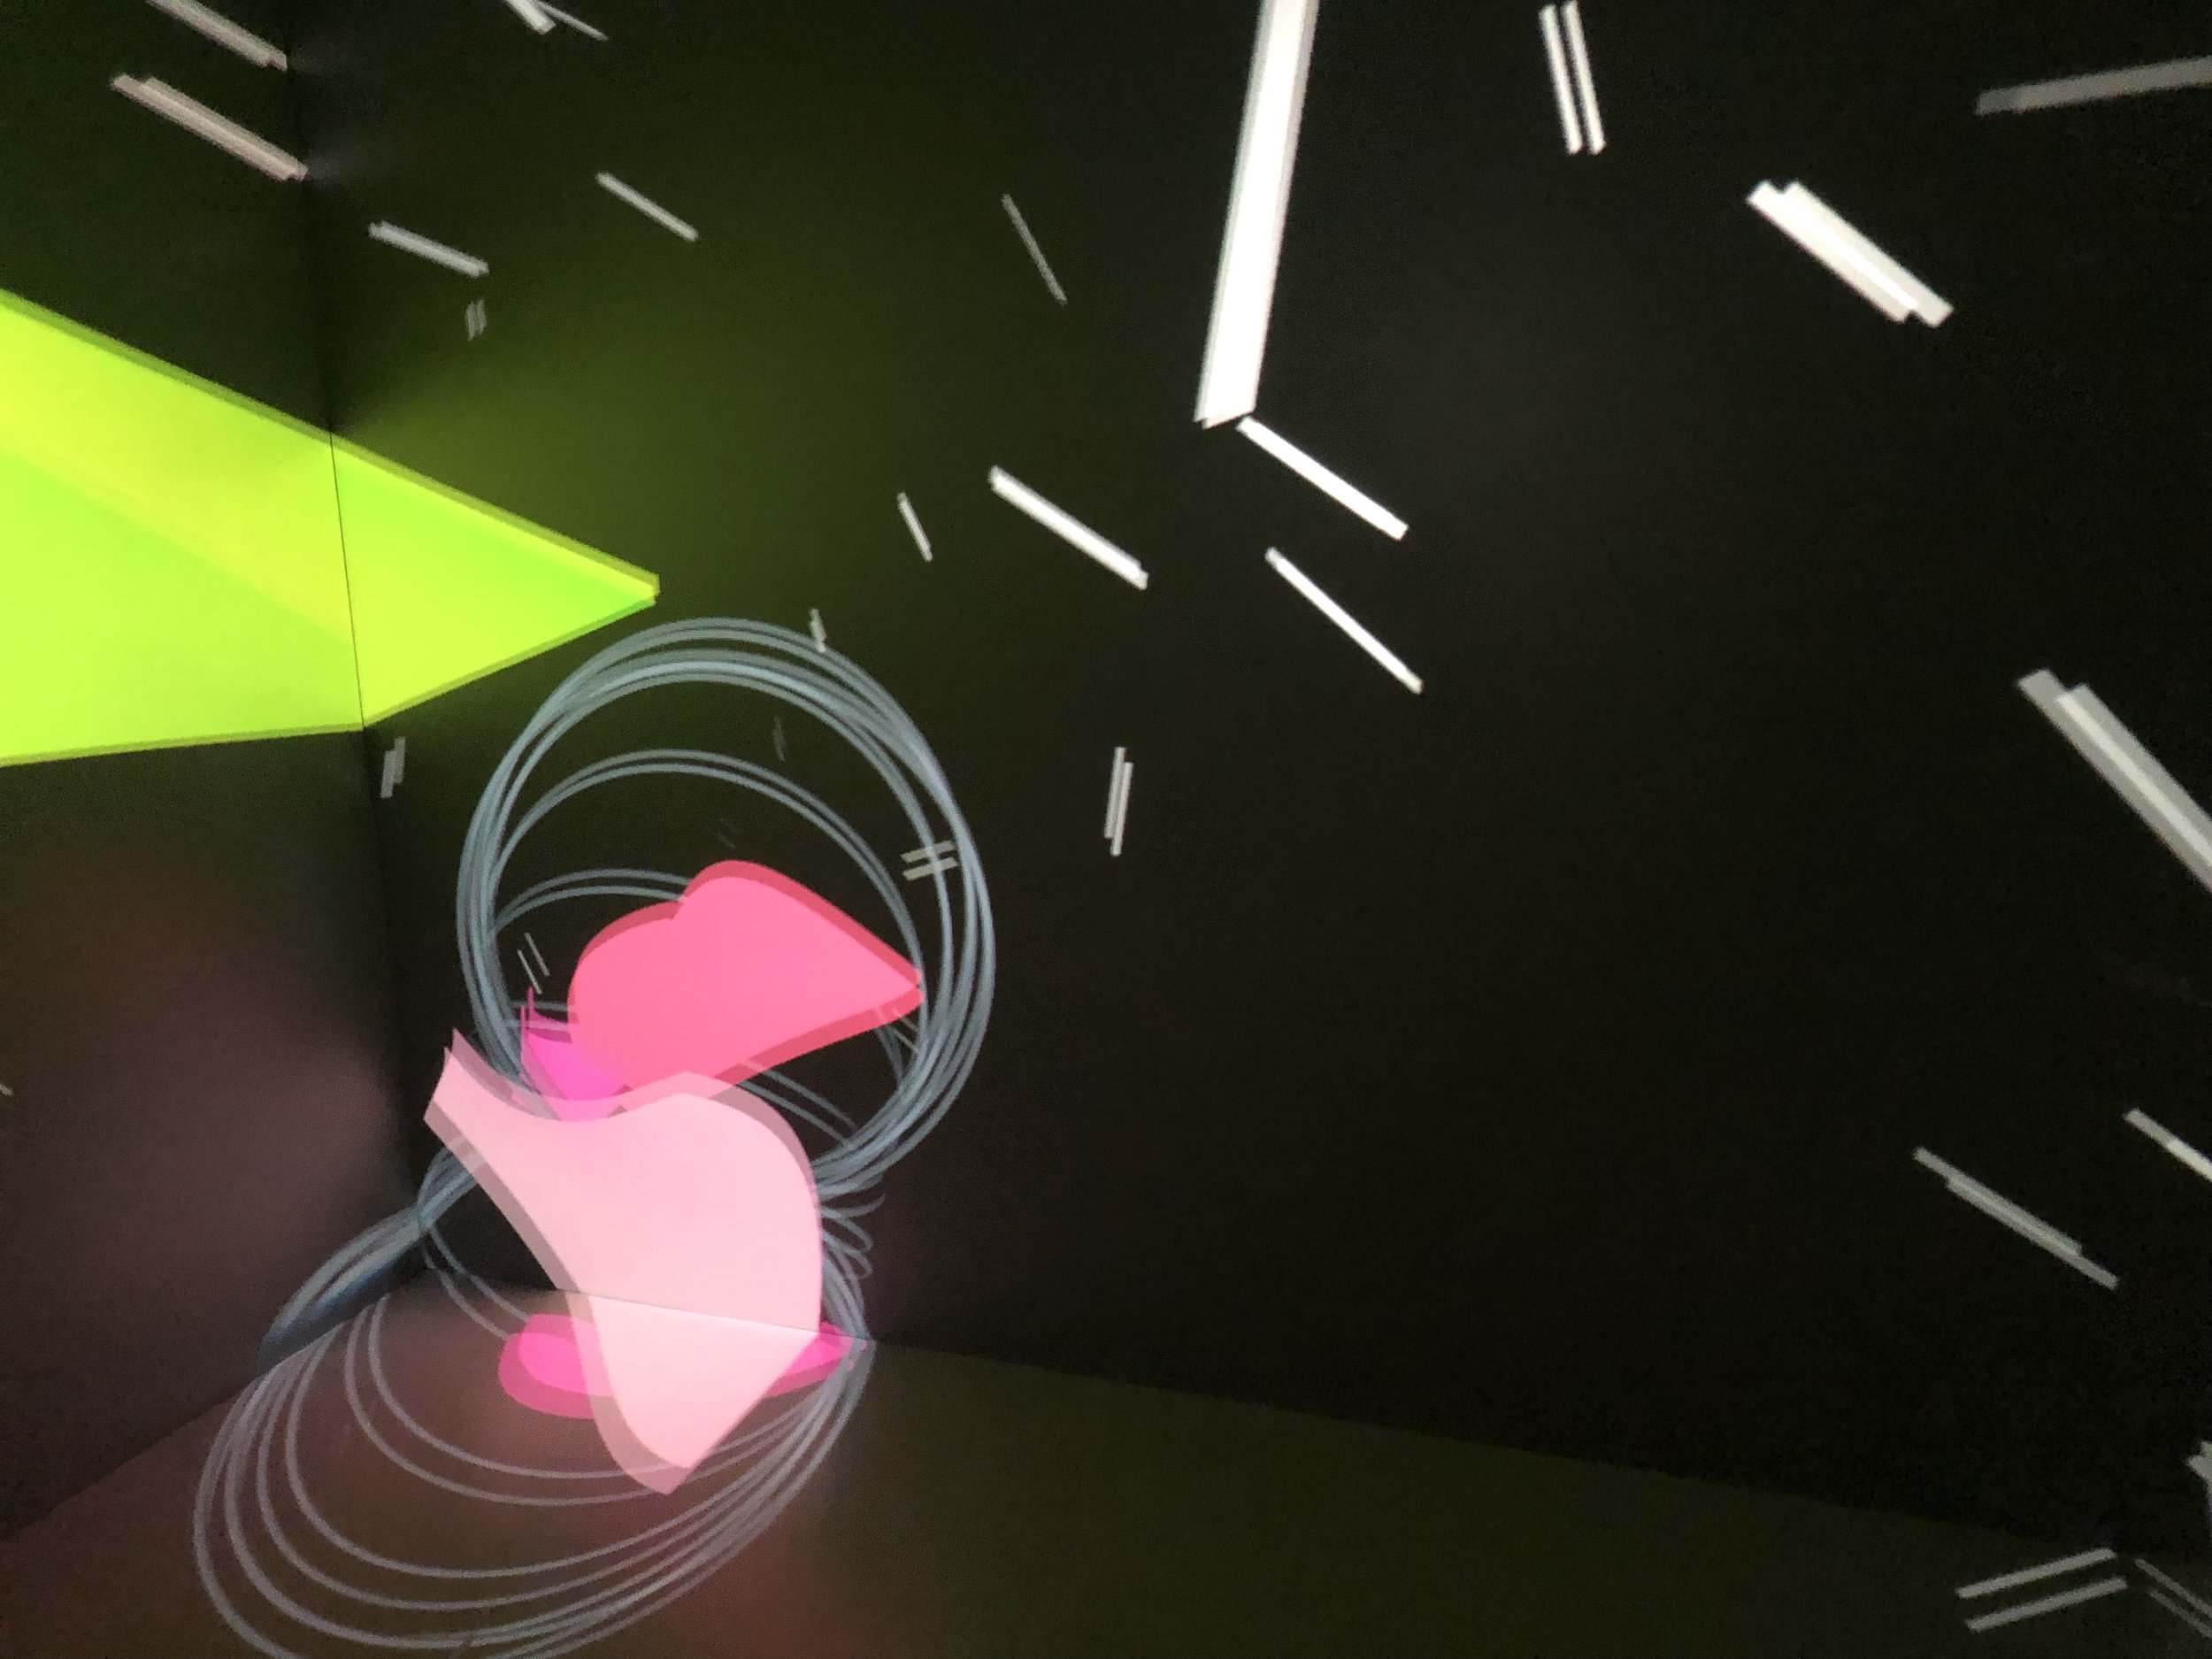
Aesthetic Choices: The aurora borealis colors were inspired by existing photos and visualizations of the phenomenon. The auroras are self-illuminating and the source of light within the model. I chose neutral colors for the geomagnetic fields and solar winds to complement the auroras. These components are reflective and appear according to the aurora’s lighting.

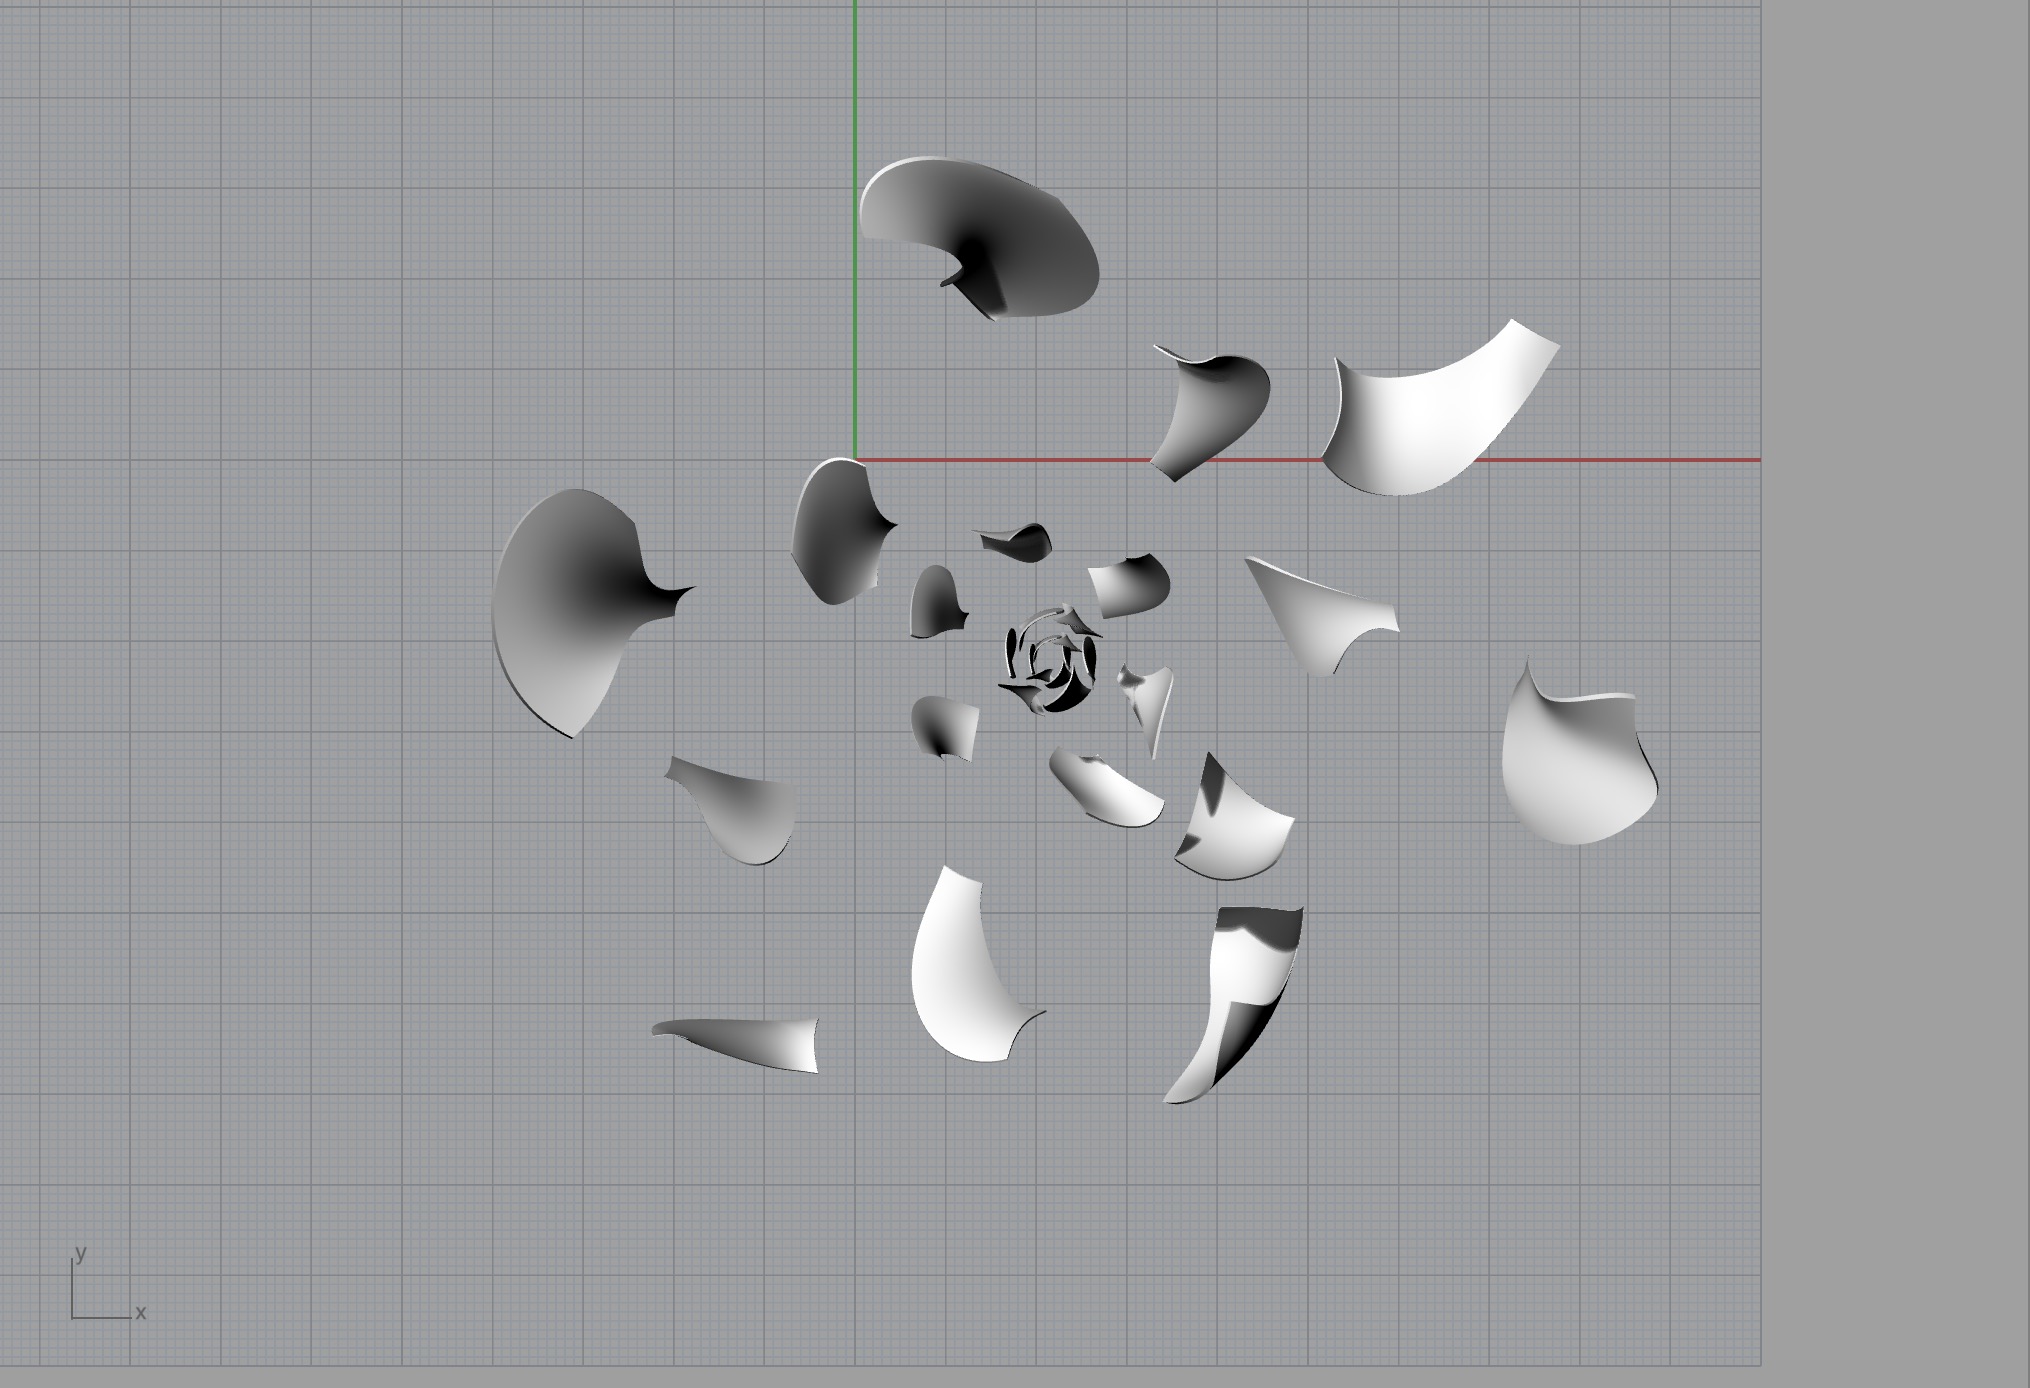
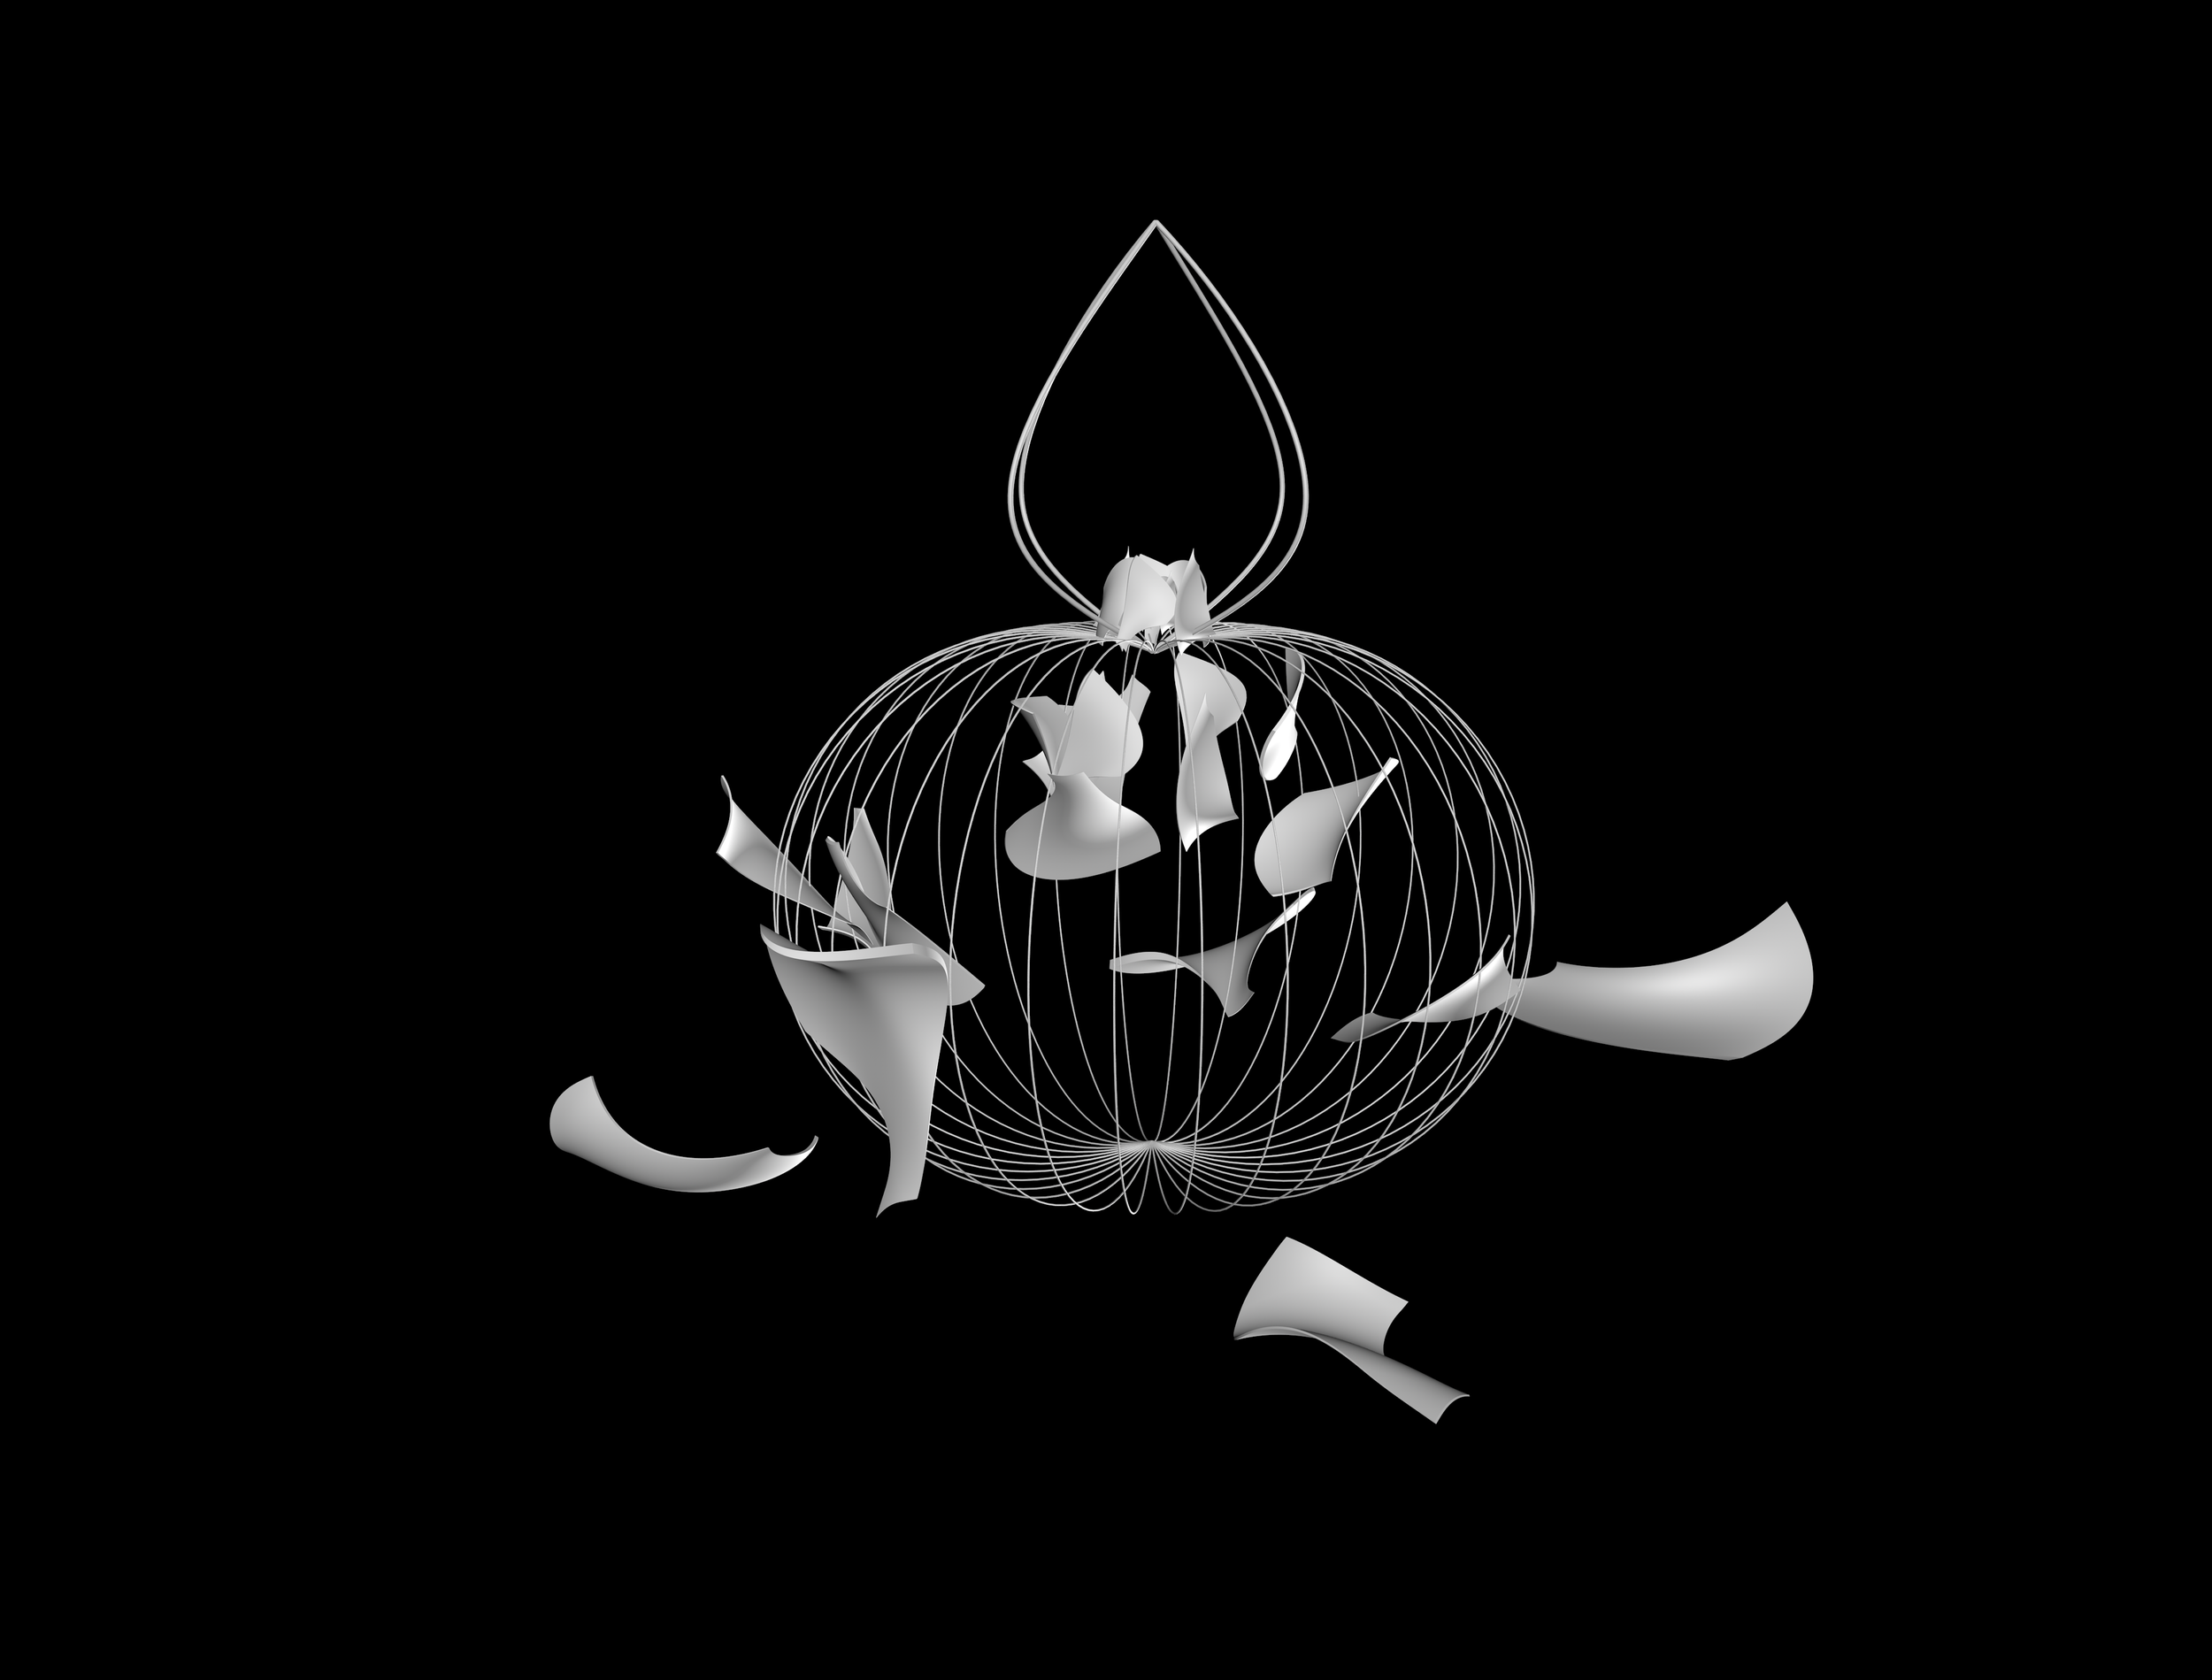
Final Model: The second iteration maintains several of the previous form decisions but is spatially different. Modeled in Rhino, the flowering aurora borealis is in the center with geomagnetic fields around it. Planar forms drift away from the center into the geomagnetic fields. Using Cinema4D, the solar winds are represented as sharp planes concentrated in the center and spreading outwards. The color choices were lastly integrated in Cinema 4D.
VR Testing
Initial Testing: Placing the model and audio within the CAVE was a new experience and required us to meet with the technicians to develop our intended experience. The technician worked with the model’s size and scale to create an expansive environment that still allowed users to traverse fairly easily.
The audio was situated with the model positionally. An underlying audio file plays throughout the whole model and three audio files are matched with the three geomagnetic storm components. When assigning audio, we found the X,Y, and Z coordinates of specific locations in the model.
Reflection
My project with the Magnetometer Lab was my first artist residency and the first time collaborating with a non-visual artist. It was invigorating to understand how art could complement the research conducted in the engineering sciences. At the weekly meetings, I was able to learn about the lab member’s research and meet them personally to gather the information I needed for my project.
I approached my work as a data visualization of the St. Patricks’s Day (2015) geomagnetic storm. Yet, through the process of conceptualizing and designing, I realized that my model was more holistic visualization. While initially disappointed—I wanted my model to be rooted in the data—I realized that my role as a resident artist was to enhance the research already conducted at the lab. Thus, I continued to push the expressiveness of my model since developing an objective, accurate data visualization wouldn’t be as original or useful within the context of a space research lab.